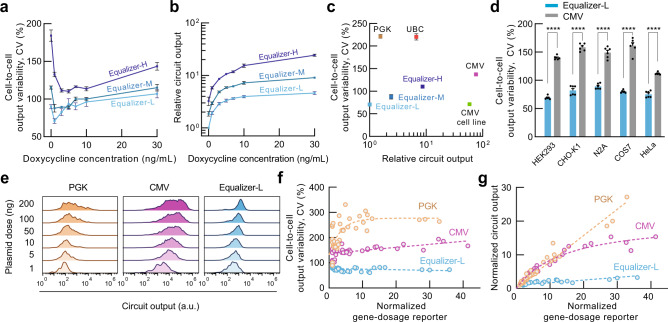
Fig. 3. Equalizers demonstrate robust gene dosage compensation at the single-cell and population levels.
Circuit output variability (a) and relative mean circuit output levels (b) of HEK293 cells transfected with the Equalizer plasmids and cultured under different inducer concentrations. Output levels are relative to that of uninduced Equalizer-L. Mean values ± SEM are shown. n = 8 (Equalizer-L) or 3 (-M/-H) independent transfections. Here and for c, d, 100 ng of circuit plasmids were used per transfection. c Equalizer plasmids produced lower cell-to-cell expression variability than plasmids with unregulated promoters. p < 0.01 for all pairs in Tukey’s multiple comparison tests. Cells transfected with Equalizer-L produced similar variability as cells with a chromosomally integrated unregulated CMV cassette (CMV cell line); p > 0.99, Tukey’s multiple comparison test. Circuit output values were relative to that of Equalizer-L. Mean ± SEM are shown; some error bars are too small to be seen. n = 3 (unregulated circuits and Equalizer-M & -H) or 8 (Equalizer-L) independent transfections. n = 3 independent cell cultures (CMV cell line). Equalizer-L was induced with 1 ng/mL of doxycycline. d Equalizer-L produced lower cell-to-cell variability than the CMV promoter in five cell lines. The black circles are independent transfections. Equalizer-L was induced with 1 ng/mL of doxycycline. Mean ± SEM are shown; some error bars are too small to be seen. n = 6 independent transfections per circuit. ****p < 0.0001; Sidak’s multiple comparison test. e Representative output-level histograms. Each histogram was normalized to its peak. For e–g, Equalizer-L was induced with 1 ng/mL of doxycycline. f Equalizer-L produced lower cell-to-cell variability than unregulated promoters at different gene dosage levels. The circles represent independent transfections. n = 36 per circuit (6 per dose and 6 doses per circuit). The dashed lines indicate trend lines (linear for Equalizer-L and CMV; exponential for PGK). The gene-dosage reporter values were normalized to those obtained when transfecting 1 ng of plasmid. g The mean Equalizer-L output is robust to increases in gene dosage. The gene-dosage and circuit output values were normalized to those obtained when transfecting 1 ng of plasmid. The circles and sample sizes are as in (f). The dashed lines indicate trend lines (linear for Equalizer-L and PGK, hyperbolic for CMV). Source data are provided as a Source Data file.

