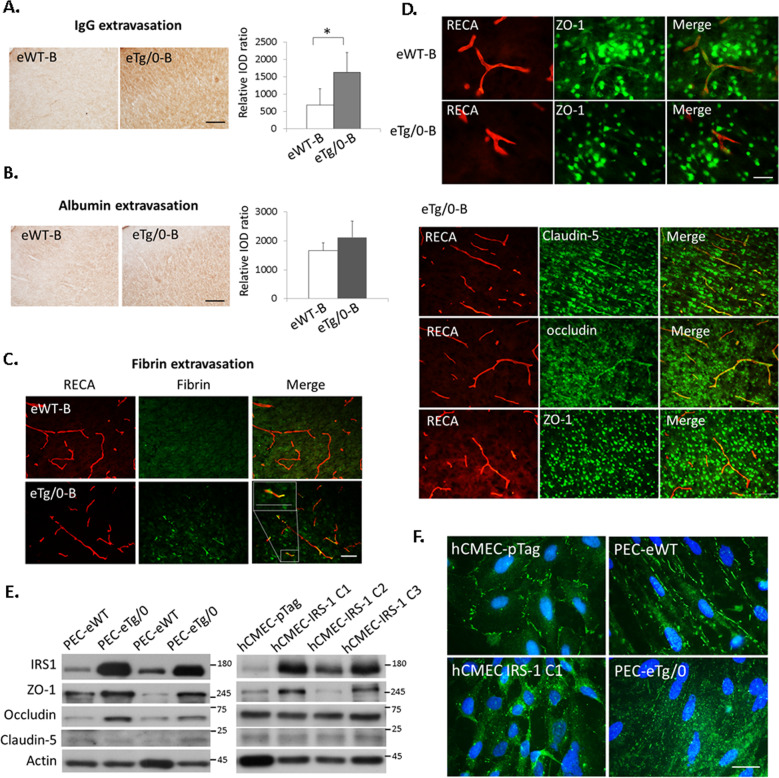
Fig. 4. Disturbed BBB functions and aberrant distribution of tight junction protein ZO-1 by IRS-1 overexpression in the endothelial cells.
A, B Representative images illustrate IgG and albumin extravasation in the cerebral cortex of endothelial-specific IRS-1 transgenic rats (eTg/0) and wide type control rats (eWT) at basal state (B, i.e. on P7 before HI), and the relative integrated optic density (IOD) of IgG (N = 6, P = 0.01, t = −3.16) and albumin (N = 6, P = 0.077, t = −2.117) signals was quantified. Scale bar: 125um. Independent t-test was used for statistical analysis. All data are presented as mean ± SD. * P < 0.05. C The eTg/0 rats had more perivascular fibrin deposits than that of eWT rats at basal state. N = 4, Scale bar: 50um. Inset scale bar: 50 μm (D) (Upper panel), The eTg/0 rats had less tight junction protein ZO-1 expression that co-localized with RECA(+) vessels than that of eWT rats at basal state. N = 4, Scale bar: 25 μm. (Lower panel) In the eTg/0 rats at basal state (eTg/0-B), in contrast to ZO-1, other tight junction proteins (claudin-5 and occludin) showed more co-localized with RECA (+) vessels. Scale bar: 50 μm. E Upregulation of IRS-1 associated with high level of ZO-1 protein expression in the primary endothelial cells (PEC) from eTg/0 pups (PEC-eTg/0) and IRS-1 overexpressed hCMEC clones (hCMEC-IRS-1 C1) compared to PEC from eWT pups (PEC-eWT) and hCMEC control clones (hCMEC-pTag), respectively. N = 5. F The distribution of ZO-1 became scattered throughout the cytoplasm of hCMEC-IRS-1 cells and PEC-eTg/0 compared to that of hCMEC-pTag control cells and PEC-eWT. N = 4, Scale bar: 25 μm.

