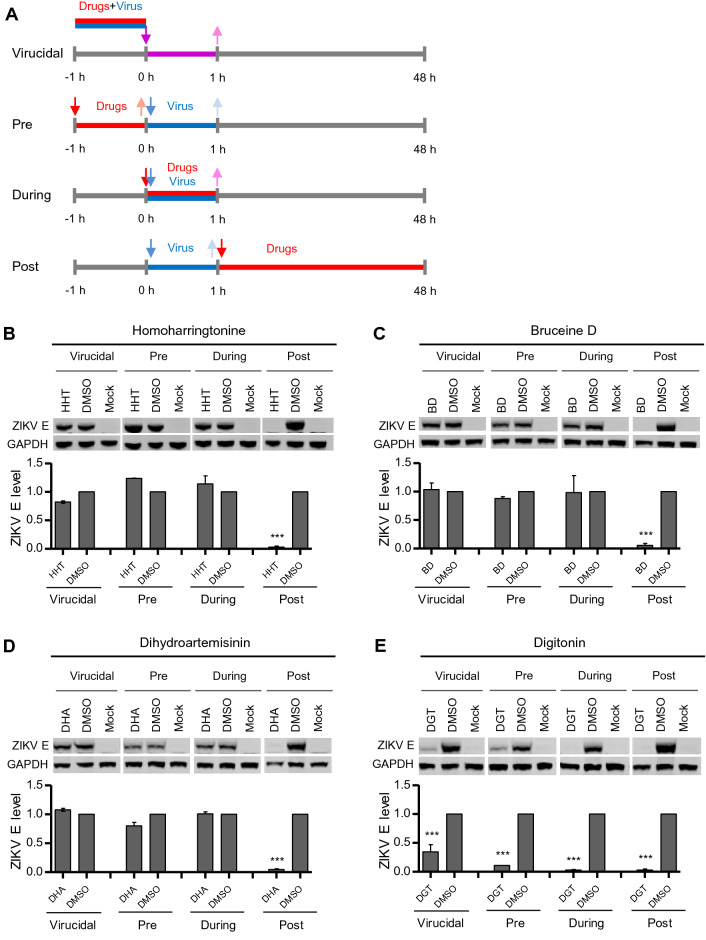
Fig. 6.
Time-of-addition analysis of the antiviral activity of the hit compounds. A Schematic illustration of the time-of-addition experiment. B, C, D and E BHK-21 cells were infected with ZIKV at an MOI of 0.01 for 1 h (0 to 1 h). Either 1 μmol/L HHT (B), 4 μmol/L BD (C), 4 μmol/L DHA (D), or 8 μmol/L DGT (E) were introduced at different time points of ZIKV infection, designated virucidal, pretreatment (pre), during treatment (during), or posttreatment (post). The inhibitory effect of the compounds in each group was determined by immunoblotting for E protein expression. Top: Representative western blot images. Bottom: Quantification of E protein band intensities relative to those for GAPDH. Data were normalized to those of DMSO-treatment cells. The data were pooled from two independent experiments. Values represent the mean ± SD. Statistical significances were determined by one-way ANOVA compared to DMSO-treated cells (***P < 0.001).

