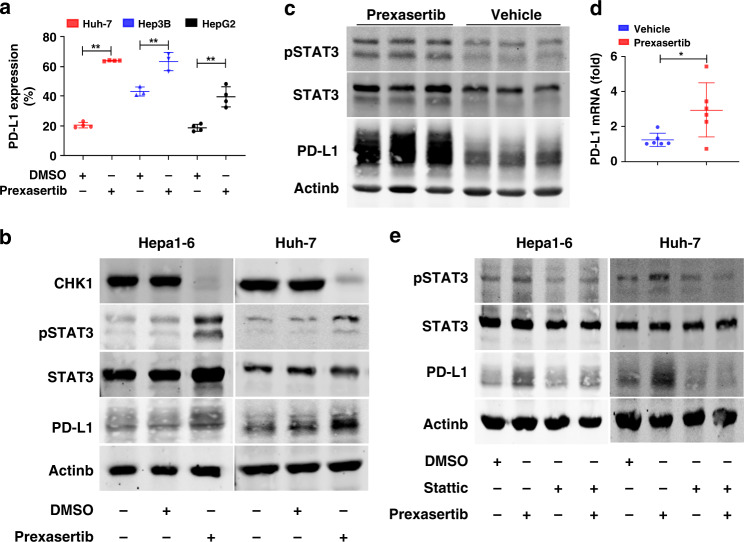
Fig. 6. Increased IRF-1 and decreased CHK1 induce PD-L1 expression of HCC cells through increased phosphorylated STAT3.
a PD-L1 expressions are measured by flow cytometry in Huh-7, Hep3B and HepaG2 treated by prexasertib with dose of 10 nM for 24 h, respectively. Each data point represents one experiment (n = 3–4). Data represent mean ± SD, **p < 0.01. b CHK1, pSTAT3, STAT3 and PD-L1 protein expression are measured by western blot in Hepa1-6 and Huh-7 cells treated by prexasertib with dose of 1 µM or 10 nM for 24 h, respectively. c pSTAT3, STAT3 and PD-L1 protein expression are detected by western blot in tumours treated by prexasertib (n = 3) or vehicle (n = 3). d PD-L1 mRNA expression is determined by qPCR in tumours treated by prexasertib (n = 6) or vehicle (n = 6). Each data point represents one mouse. Data represent mean ± SD, *p < 0.05. e pSTAT3, STAT3 and PD-L1 are detected by western blot in Hepa1-6 and Huh-7 HCC cells treated with prexasertib and/or Stattic (10 µM) for 24 h. Representative western blot images shown are from three individual experiments.

