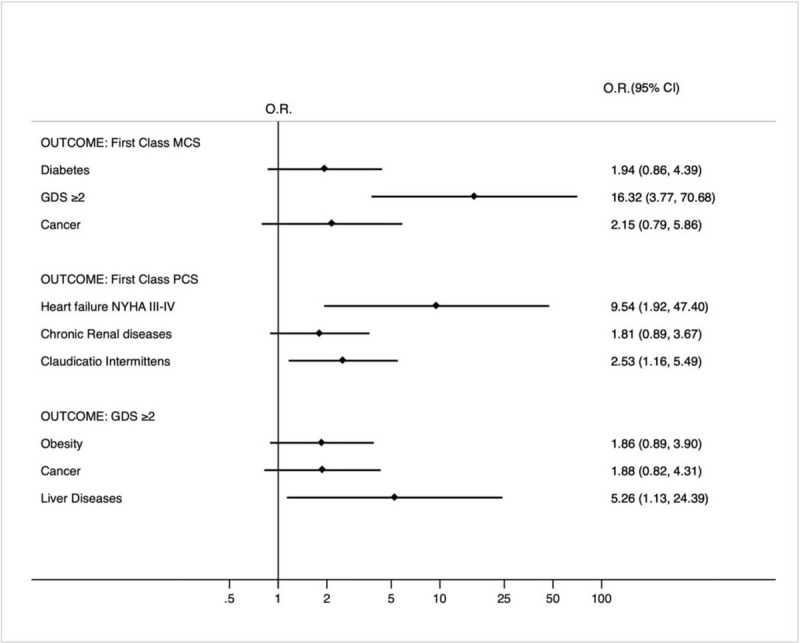
Figure 1.

Multivariate analysis according to first class MCS, first class PCS and GDS ≥ 2 (high risk of depression) (OR = odds ratio; 95% CI = 95% confidence interval). The variables reported in the three models were selected by the Hosmer–Lemeshow methodology; only variables with a P < .20 are shown in the graph. ∗GDS = Geriatric depression score, MCS =Mental component score, PCS = Physical component score.
