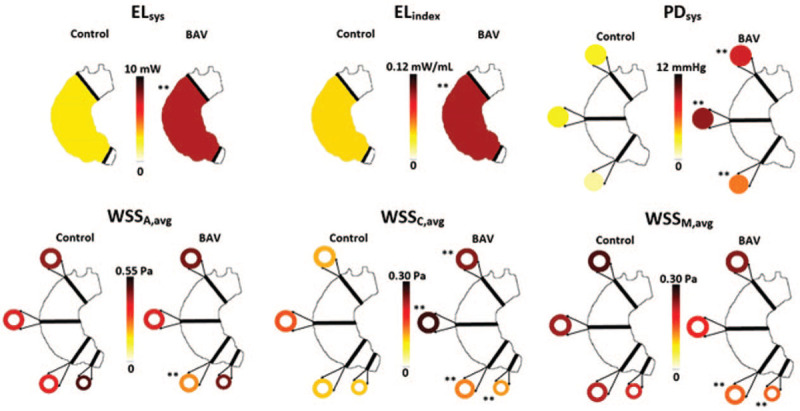
Figure 3.

Hemodynamic contrasts between controls and BAV cohorts. Each color-coded value represents the mean value of its respective cohort. BAV, bicuspid aortic valve; ELindex, peak systolic viscous energy loss normalized to LVOT net flow; ELsys, peak systolic viscous energy loss; LVOT, left ventricular outflow tract; PDsys, peak systolic pressure drop; WSSA,avg, circumference-averaged axial wall shear stress; WSSC,avg, circumference-averaged circumferential wall shear stress; WSSM,avg, circumference-averaged magnitude wall shear stress. ∗∗P < 0.01.
