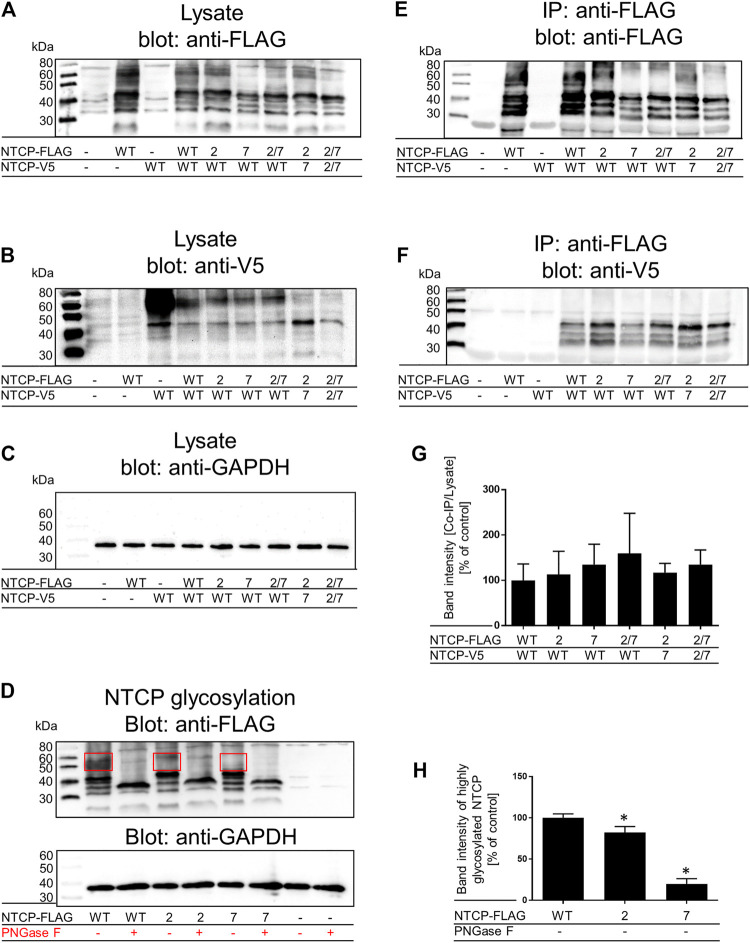
FIGURE 3.
Co-IP and glycosylation status of wild-type and mutant NTCPs. Wild-type and mutant NTCP-V5-His and NTCP-FLAG constructs were mono-transfected or co-transfected into HEK293 cells as indicated. Cell lysates were analyzed by western blotting with (A) an anti-FLAG antibody, (B) an anti-V5 antibody or (C) and anti-GAPDH antibody. Cell lysates from un-transfected cells were used as negative control, mono-transfected cells served as positive controls. In the figure legend the NTCP TMD2, TMD7 and TMD2/7 mutants are briefly indicated as “2”, “7” and “2/7”, respectively. These cell lysates were also used for IP with anti-FLAG agarose and then were processed for western blotting with (E) an anti-FLAG antibody or (F) an anti-V5 antibody. (G) Band intensities of three independent co-IP experiments were measured using ImageJ and signal intensities from the IP anti-V5 signals were normalized for the lysate anti-FLAG signals. Ratios were related to the NTCP(WT)-NTCP(WT) interaction, which was set to 100%. Data represent means ± SD of three independent experiments, one of which is representatively shown under (A–C), and (E, F). (D) Cell lysates of wild-type and mutant NTCP-FLAG mono-transfected HEK293 cells were subjected to deglycosylation with PNGaseF. The glycosylated and deglycosylated samples were visualized by western blotting with an anti-FLAG antibody and an anti-GAPDH antibody. (H) Band intensities of the highly glycosylated wild-type and mutant NTCPs (bands with apparent molecular weight of 50–60 kDa as indicated by frame) were quantified using ImageJ. The values were then compared to wild-type NTCP-FLAG, which was set to 100%. Data represent means ± SD of three independent experiments. *Significantly different from wild-type with p < 0.05 (one-way ANOVA with Dunnett’s multiple comparison test).

