
Figure 3.
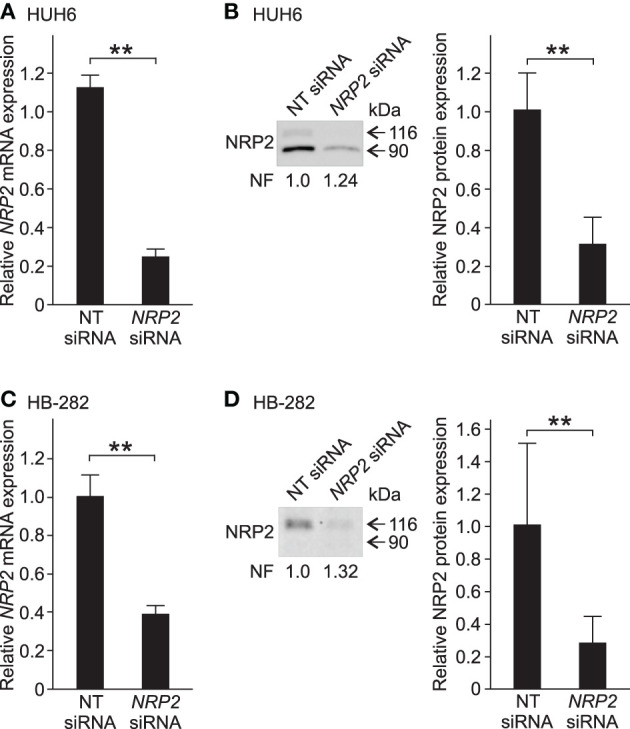
NRP2 silencing in HB cells. In HUH6 cells, NRP2 mRNA expression was reduced 75% after 72 h of NRP2 siRNA transfection compared to NT control (A). Protein band intensity of NRP2 was 70% lower in NRP2 siRNA treated cells in contrast to NT control cells (B). In HB-282 cells, NRP2 expression was reduced 60% at mRNA and 70% at protein level in NRP2 siRNA transfected cells compared to control cells (C,D). Bar plots are presented as relative values of mean of three independent experiments ± RSD. Band intensity is normalized to total protein expression of each lane. Normalization factor (NF) describing the amount of total protein in lane in relation to other lanes is given beneath the bands (B). **p-value < 0.01. NT, non-targeting.