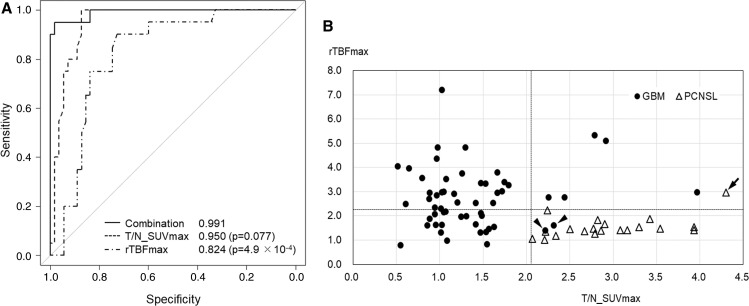
Fig. 2 .
(A) ROC curves generated using FDG-PET (middle broken line), ASL (lower broken line), and the combined use of two parameters according to generalized linear model (solid line). The AUC of the combined model (0.991) is higher than that of the T/N_SUVmax alone (0.950) and that of rTBFmax alone (0.824). And, the sensitivity and specificity discriminating PCNSL from GBM were 100% and 87.3% in T/N_SUVmax, 90% and 72.7% in rTBFmax, respectively. (B) A scatter diagram showing distribution along the rTBFmax (vertical) and T/N_SUVmax (horizontal) axes. The cutoff values of 2.23 for rTBFmax and 2.07 for T/N_SUVmax are shown with broken lines. The solid circles and open triangles depict GBM and PCNSL, respectively. Applying the cutoff points, the sensitivity and specificity for discrimination between PCNSL from GBM were 95% and 96.4%, respectively. One of the GBM cases (the left arrowhead) was the only case originating from the posterior fossa (the cerebellar vermis) in the present series. Histologically, this case included oligodendroglioma component and showed a high Ki67 index (88%). Another case with GBM of the right temporal lobe was that of a 22-year-old male patient (the right arrowhead), the youngest in the present series. Histological findings revealed a pleomorphic appearance, including giant and multinucleate cells with a high Ki67 index (41%). Despite their aggressive histological features, their clinical course was similar to the other cases with GBM. The misdiagnosed case of PCNSL (the arrow) showed high T/N_SUVmax and rTBFmax; however, its histological and clinical characteristics did not differ from that of the other PCNSL cases. AUC: area under the curve, FDG-PET: 18F-fluorodeoxyglucose positron emission tomography, GBM: glioblastoma, PCNSL: primary central nervous system lymphoma, ROC: receiver-operating characteristic, rTBFmax: relative maximum tumor blood flow, T/N_SUVmax: ratio of tumor to normal contralateral gray matter and maximum standardized uptake values.

