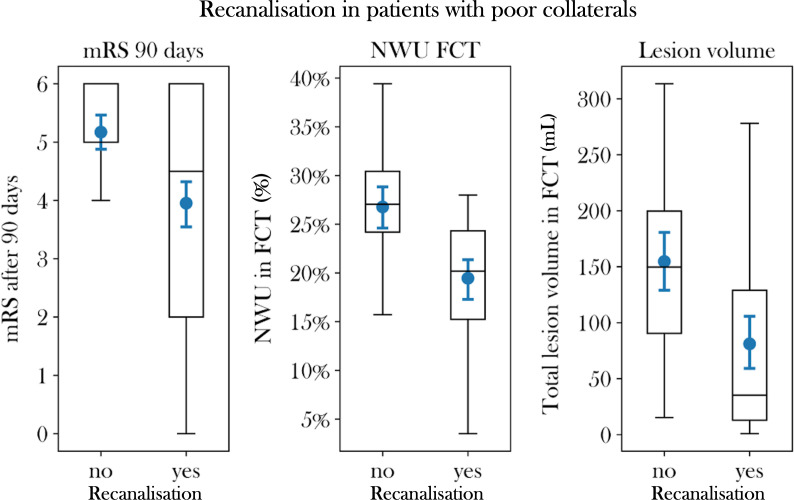
Figure 3.
Clinical outcome, quantitative lesion water uptake and total lesion volume in the study cohort. Boxplots to illustrate differences in clinical outcome, indicated by modified ranking scale scores (mRS) at 90 days (left), per cent lesion water uptake in follow-up CT (FCT, middle) and total lesion volume (right) in patients with successful vessel recanalisation versus persistent vessel occlusion. NWU, netwater uptake.

