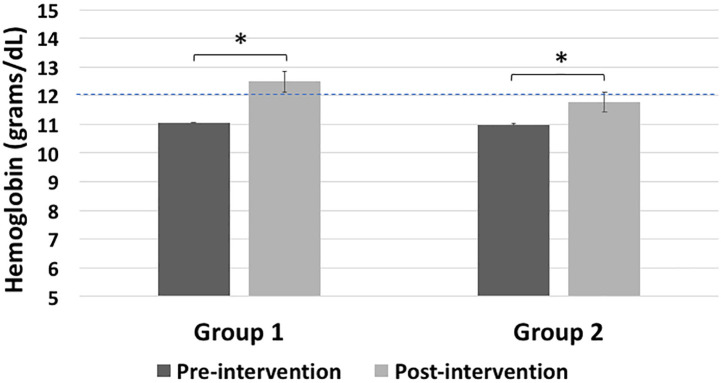
Figure 3.
Comparison of mean haemoglobin concentration in women from Group-1 and Group-2 at baseline (pre-intervention) (dark shaded bars) and after 2 months (post-intervention) (light shaded bars) consumption of a daily cup of tea using folate-fortified and vitamin B12-fortified teabags (Group-1, n=12, containing 0.1 mg vitamin B12 plus 1 mg folate per cup) and (Group-2, n=11, containing 0.5 mg vitamin B12 plus 1 mg folate per cup). The horizontal dashed line (set at 12 g/dL) signifies the cut-off between normal haemoglobin concentration and anaemia at sea level. Data is shown as mean±SE. The asterisk signifies a statistically significant difference (p<0·05) in the pre-intervention versus post-intervention haemoglobin concentration within each Group.

