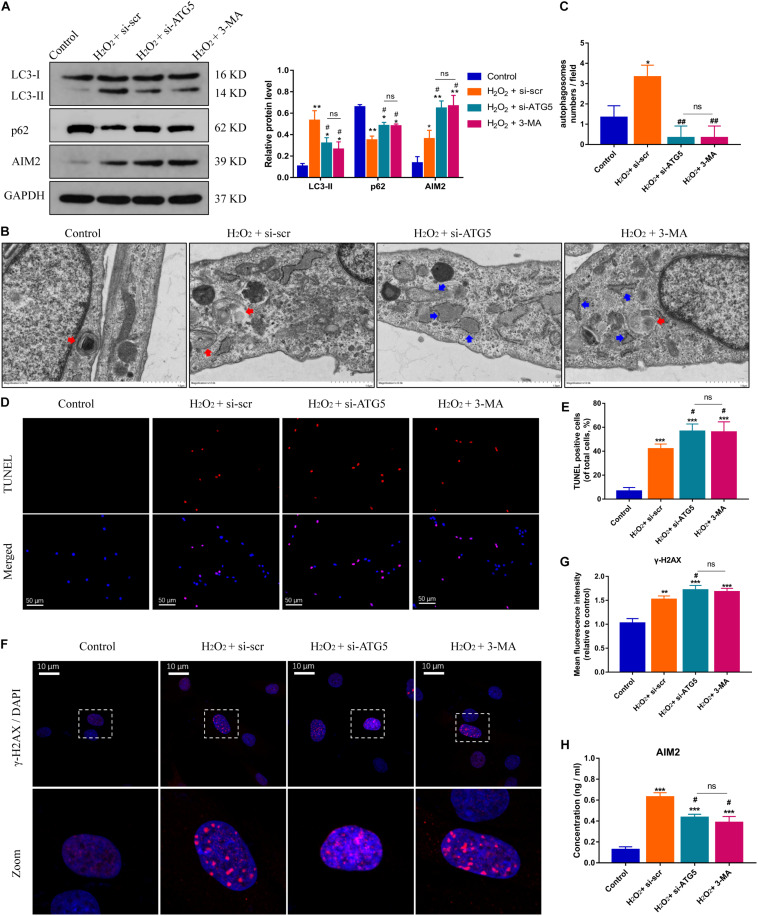
FIGURE 4.
Inhibition of autophagy aggravates DNA damage and NP cell apoptosis, and decreases AIM2 secretion. (A) Protein levels and quantification of AIM2, LC3, and p62 in H2O2-treated NP cells co-treated with si-scr, si-ATG5, or 3-MA (20 mM, 8 h). (B,C) TEM images of NP cells indicated the number of autophagosomes (red arrows) and irregular intracellular vesicles (blue arrows), and quantification of autophagosomes numbers (C). (D,E) TUNEL images of NP cells in different groups (D) and corresponding quantification of cell apoptosis (E). (F,G) Immunostaining of γ-H2AX (F) and mean fluorescence intensity of NP cells in different groups (G). (H) Extracellular levels of AIM2 measured by ELISA analysis. Data were presented as the means ± SD, n = 3. *P < 0.05, **P < 0.01, ***P < 0.001 vs. control group; #P < 0.05, ##P < 0.01 vs. H2O2-si-scr group; ns, P > 0.05, no significant difference.

