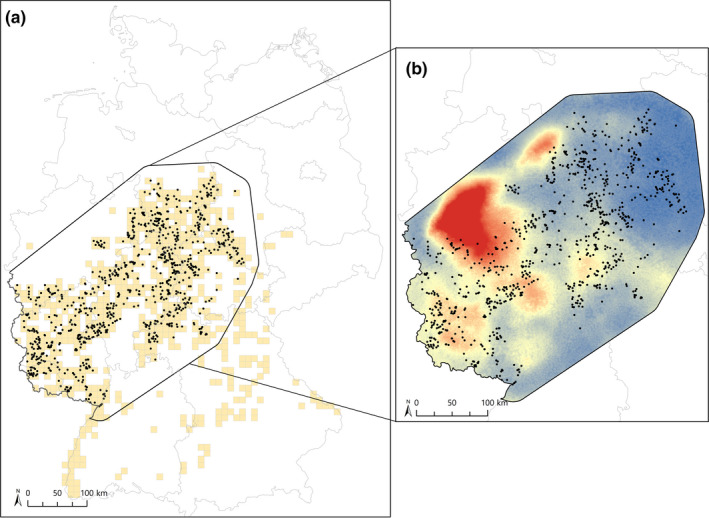
FIGURE 1.

Distribution of wildcat in Germany and position of 975 genetic samples used for this study (a; beige = wildcat data from Balzer et al., 2018, black = genetic samples). Final, multivariate resistance to gene flow within the study area, as inferred from our analyses (b). We weighted each of the resistance surfaces of the selected landscape variables (i.e., road density within a 35 km radius, proportion of forest within a 35 km radius, proportion of forest within a 35 km radius, distance to settlements, distance to Continuous Low Traffic Areas, topographic slope, and straight‐line distance) by its beta weights from commonality analyses and then summed up the resulting layers. The gradient runs from red (high resistance) to blue (low resistance)
