
FIGURE 3.
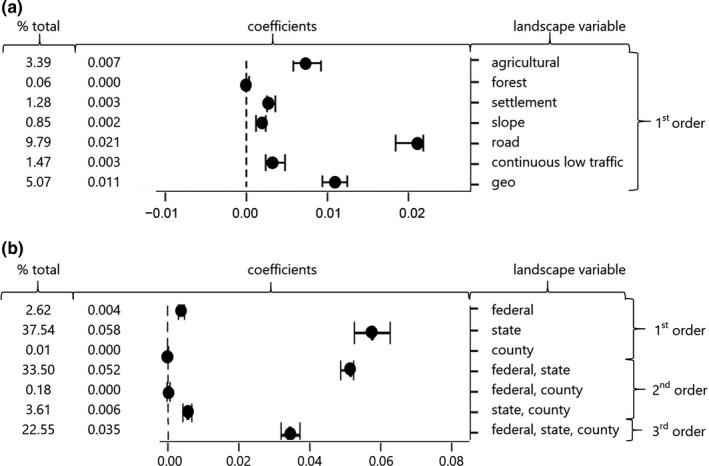
Results of the commonality analysis: coefficients with 95% confidence intervals and their contribution to the overall model R 2 (% total). Coefficients represent the percentage of variance explained by each set of landscape variables (a; only 1st‐order effects; see Figure S1 for all effects) and different road types (b). Forest = proportion of forest in 35 km radius, farm = proportion of agricultural land within 35 km radius, settlement = distance to settlements, road = road density within 35 km radius, continuous low traffic = distance to Continuous Low Traffic Areas, geo = straight‐line distance