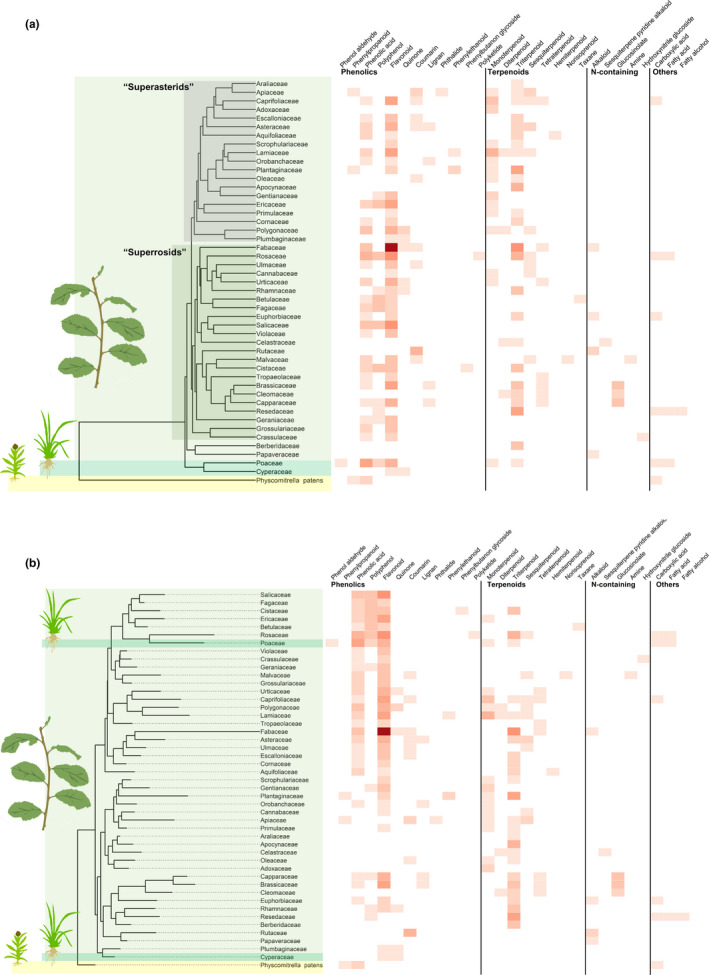
FIGURE 1.

Heatmap of secondary metabolite diversity per butterfly host plant family. Intensity of shading indicates diversity of compounds found in the literature per host plant family, expressed as the number of subclasses per unique secondary metabolite class. Plant icons indicate the following: leaves for eudicots, grass for monocotyledons, and a moss for mosses (a) Host plant families are positioned according to phylogeny following Ramírez‐Barahona et al. (2020). (b) Host plant families are positioned according to chemical defense relationships in a chemical defensogram based on the secondary metabolite matrix in Table S2
