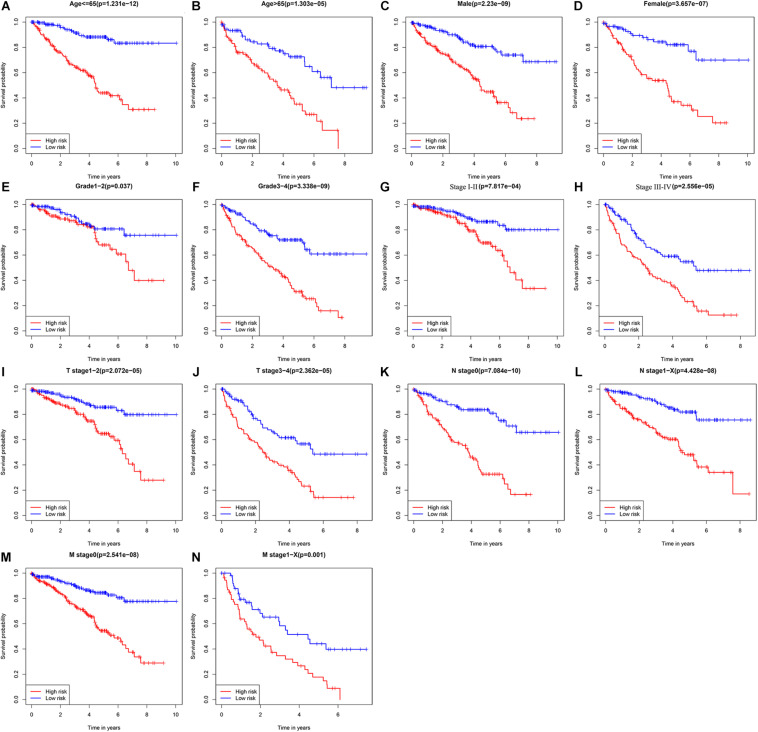
FIGURE 5.
Kaplan-Meier survival curves analysis stratified by different clinical parameters. (A) Age ≤ 65 (n = 353); (B) age > 65 (n = 186); (C) male (n = 353); (D) female (n = 186); (E) grade 1–2 (n = 249); (F) grade 3–4 (n = 282); (G) stage I–II (n = 331); (H) stage III–IV (n = 205); (I) T stage 1–2 (n = 349); (J) T stage 3–4 (n = 190); (K) N stage 0 (n = 241); (L) N stage 1-X (n = 298); (M) M stage 0 (n = 428); (N) M stage1-X (n = 109) (the statistical method was a log-rank test for a single factor).

