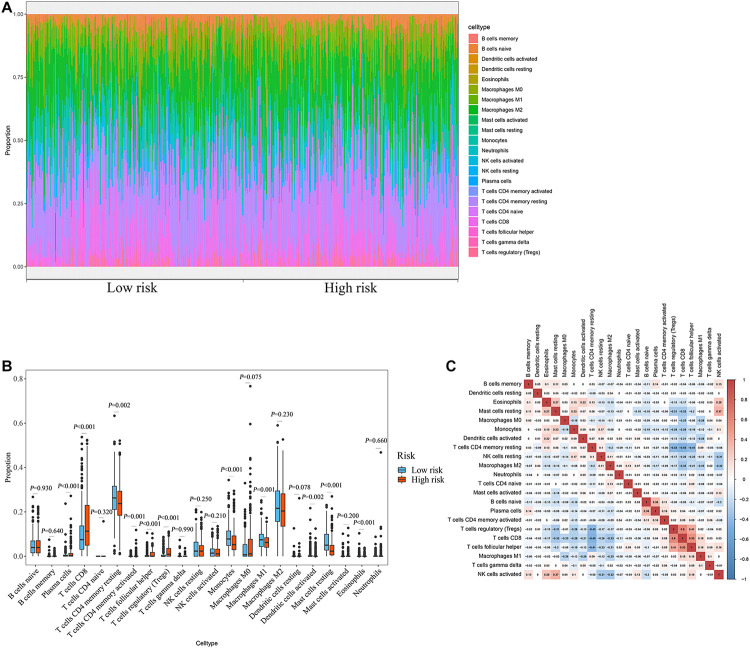
FIGURE 8.
Relationship between prognostic signature and immune cell infiltration. (A) Stacked bar chart of the distribution of 22 immune cells in each ccRCC sample of the TCGA cohort (n = 539). (B) Box plot of immune cell infiltrates in ccRCC patients at high- (n = 269) and low-risk (270). (C) Immune cell proportional correlation matrix (the statistical method was t-test).

