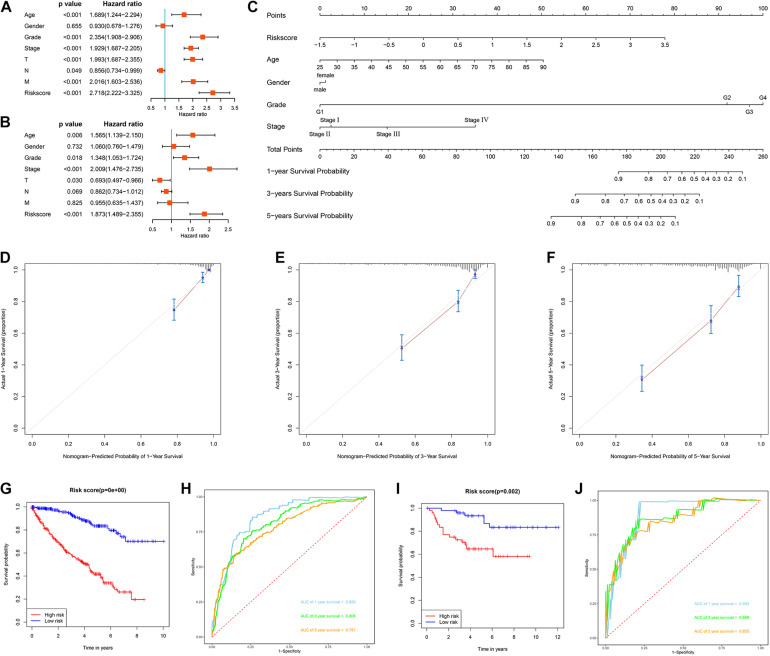
FIGURE 9.
Evaluation of the prognostic significance of different clinical characteristics in ccRCC patients and construction of a nomogram. (A) Univariate Cox regression analyses in the TCGA cohort ccRCC patients (n = 539); (B) multivariate Cox regression analyses in the TCGA cohort ccRCC patients (n = 526); (C) the nomogram for predicting the 1-, 3-, and 5-year OS of ccRCC patients (n = 526); (D) the calibration curve of the nomogram for predicting 1-year OS of ccRCC patients; (E) the calibration curve of the nomogram for predicting 3-year OS of ccRCC patients; (F) the calibration curve of the nomogram for predicting 5-year OS of ccRCC patients; (G) Kaplan-Meier survival curve analysis in the TCGA cohort based the nomogram (n = 526); (H) ROC curve analysis shows 1, 3, and 5-year OS and the corresponding AUC values for ccRCC patients from the TCGA cohort based the nomogram (n = 526); (I) Kaplan-Meier survival curve analysis in the E-MTAB-1980 cohort based the nomogram (n = 99); (J) ROC curve analysis shows 1, 3, and 5-year OS and the corresponding AUC values for ccRCC patients from the E-MTAB-1980 cohort based the nomogram (n = 99) (the statistical method was a log-rank test for a single factor).

