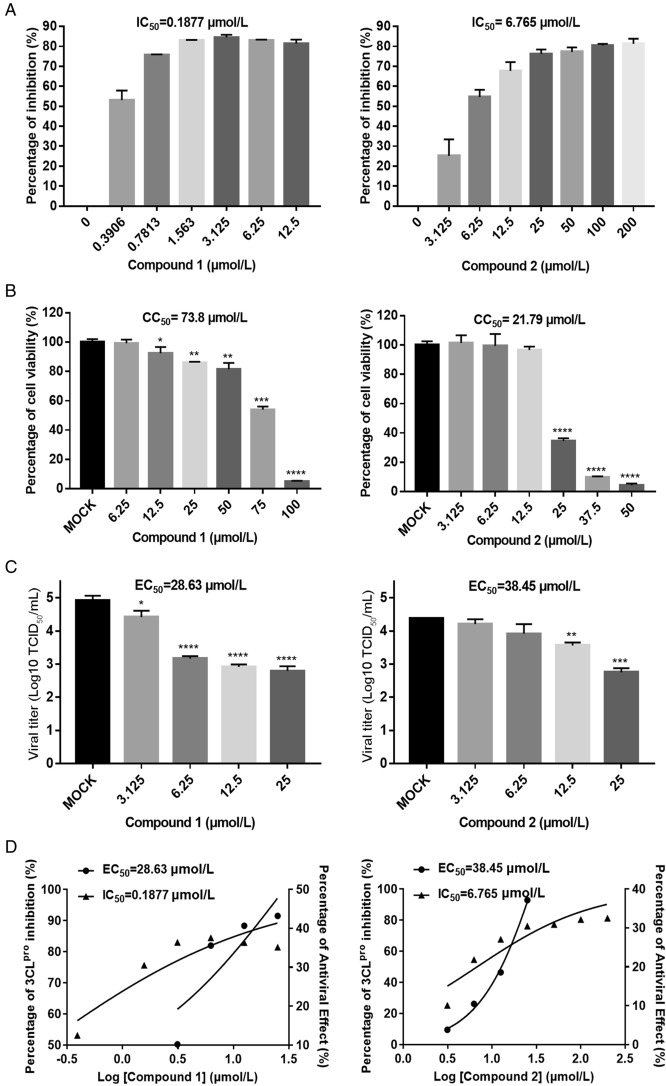
Fig. 2.
Dose response for compounds 1 and 2 in suppressing PEDV 3CLpro activity and PEDV replication in Vero cells. Each concentration in the dose–response experiment was assayed in triplicate: A FRET assays were performed to measure the IC50 values of compounds 1 and 2, reflecting their ability to inhibit PEDV 3CLpro activity. B Cell viability analysis of compound 1 (6.25–100 µmol/L) and compound 2 (3.125–50 µmol/L) in Vero cells. C Inhibitory effects of compound 1 (3.125–25 µmol/L) and compound 2 (3.125–25 µmol/L) in PEDV-infected cells at an MOI of 0.1. Cell culture supernatant was harvested for TCID50 assays after incubation with serial dilutions of the test compounds for 16 h. D Dose–response curves determing the IC50 and EC50 values of compounds 1 and 2 by nonlinear regression. Bars represent the SD from triplicate trials (* represents a significant difference between test concentration and control; *P < 0.05; **P < 0.01; ***P < 0.001; and ****P < 0.0001).

