Fig. 4.
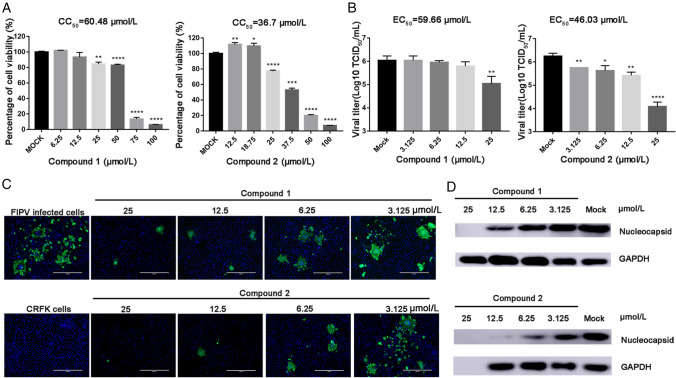
A Cell viability analyses of compound 1 (6.25–100 µmol/L) and compound 2 (3.125–50 µmol/L) in CRFK cells. B Inhibitory effects of compound 1 (3.125–25 µmol/L) and compound 2 (3.125–25 µmol/L) in FIPV-infected cells at an MOI of 0.1. Cell culture supernatant was harvested for TCID50 assays after incubation with serial dilutions of test compounds for 20 h (* represents a significant difference between test concentration and control; *, P < 0.05; **, P < 0.01; ***, P < 0.001; and ****, P < 0.0001). (C) Immunofluorescence assay of compounds 1 and 2 against FIPV in CRFK cells. FIPV-infected cells were tested as a control group. Serial dilutions of the test compounds from 3.125 µM to 25 µmol/L were assessed independently. Nuclei were stained with DAPI (blue fluorescence), and FIPV infection was detected using a monoclonal antibody followed by FITC-tagged goat anti-rabbit IgG (green fluorescence). Bars represent the SD from triplicate trials. (D) Western blot analysis of the effects of compounds 1 and 2 on the production of CoV N protein in FIPV-infected cells. GAPDH was used as an internal control.

