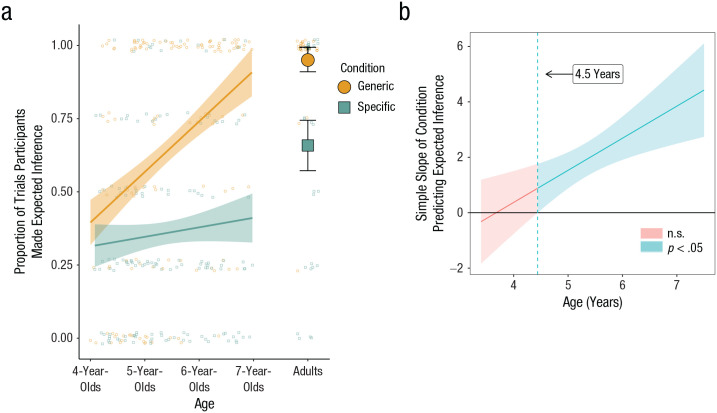
Fig. 3.
Property inference in Study 1. The proportion of trials in which participants made the expected inference (i.e., responded “yes” that an individual of the mentioned group had the target property but “no” that an individual of the unmentioned group did not; a) is shown as a function of age and condition. Error bars and bands reflect 95% confidence intervals. Small shapes reflect individual averages, and large shapes and lines reflect group averages. In the Johnson-Neyman plot (b), the line reflects a difference in the simple slope of condition predicting participants’ inferences as a function of age. The age at which making inferences across conditions became significantly different is marked by the dashed vertical line.

