
Figure 6.
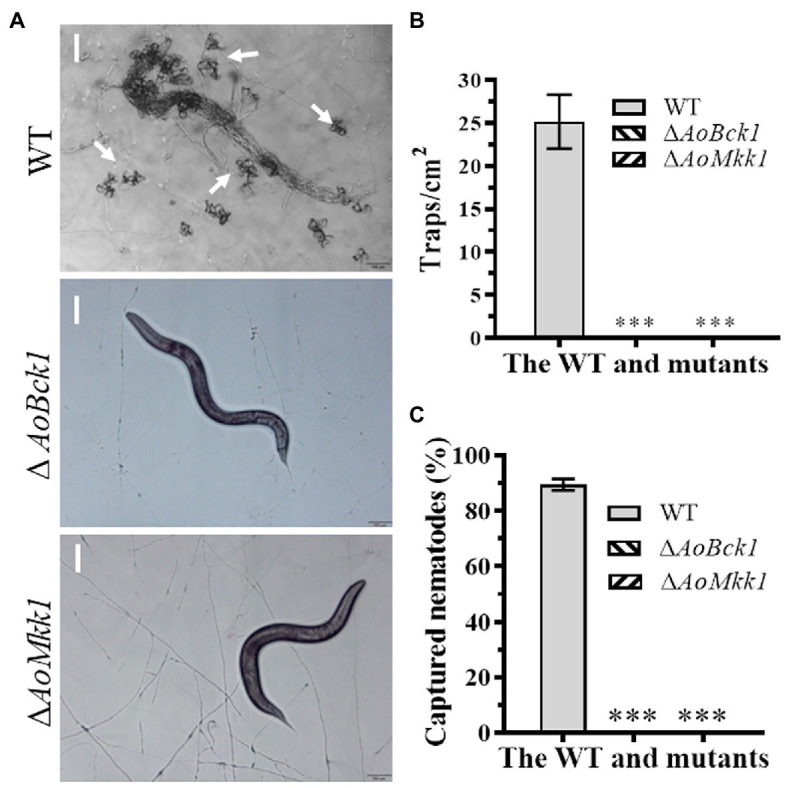
Comparison of trap formation and nematocidal activity between the WT and mutants. (A) Trap formation of fungal strains induced by nematodes at 48 h. White arrows: Traps. Bar: 50 μm. (B) Comparison of traps produced by the WT and mutants at 48 h. (C) Comparison of captured nematodes by the WT and mutant strains at 48 h. The asterisk indicates a significant difference compared to the WT (p < 0.05).