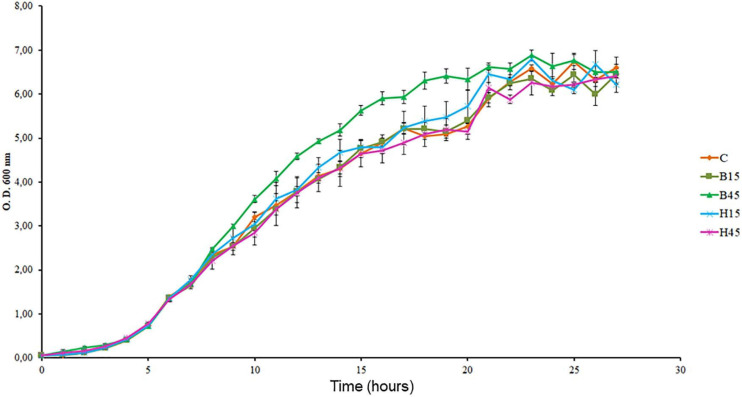
FIGURE 2.
Growth curves of Pseudomonas sp. CMA 6.9 in control treatments (C) and with the herbicides Boral® (B15 and B45) and Heat® (H15 and H45), determined by OD at 600 nm. Data were obtained in triplicate for each treatment and statistically analyzed using a randomized complete block design using the Duncan test (p < 0.05). Error bars represent standard errors of the means.

