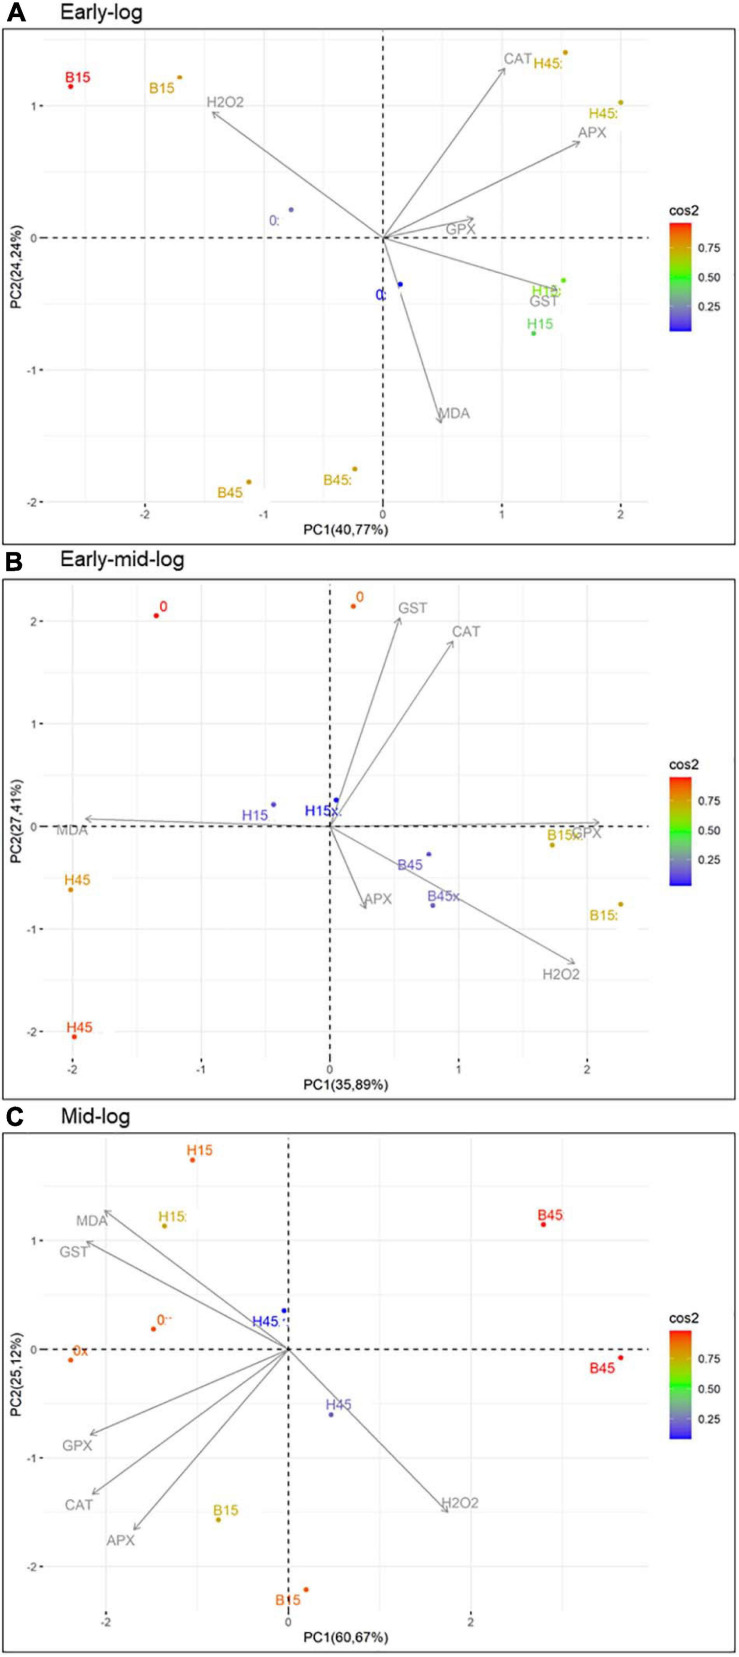
FIGURE 9.
PCA of the relationships between quantifications of stress indicators H2O2 and MDA and profiles of enzymatic activities of CAT, APX, GPX, and GST of Pseudomonas sp. CMA 6.9 in the three growth phases indicated. (A) Early-log phase; (B) Early mid-log phase; (C) Mid-log. Color scale indicates the degree of contribution of the data distribution. CAT, catalase; APX, ascorbate peroxidase; GPX, guaiacol peroxidase; GST, glutathione S-transferase.

