
Figure 3 .
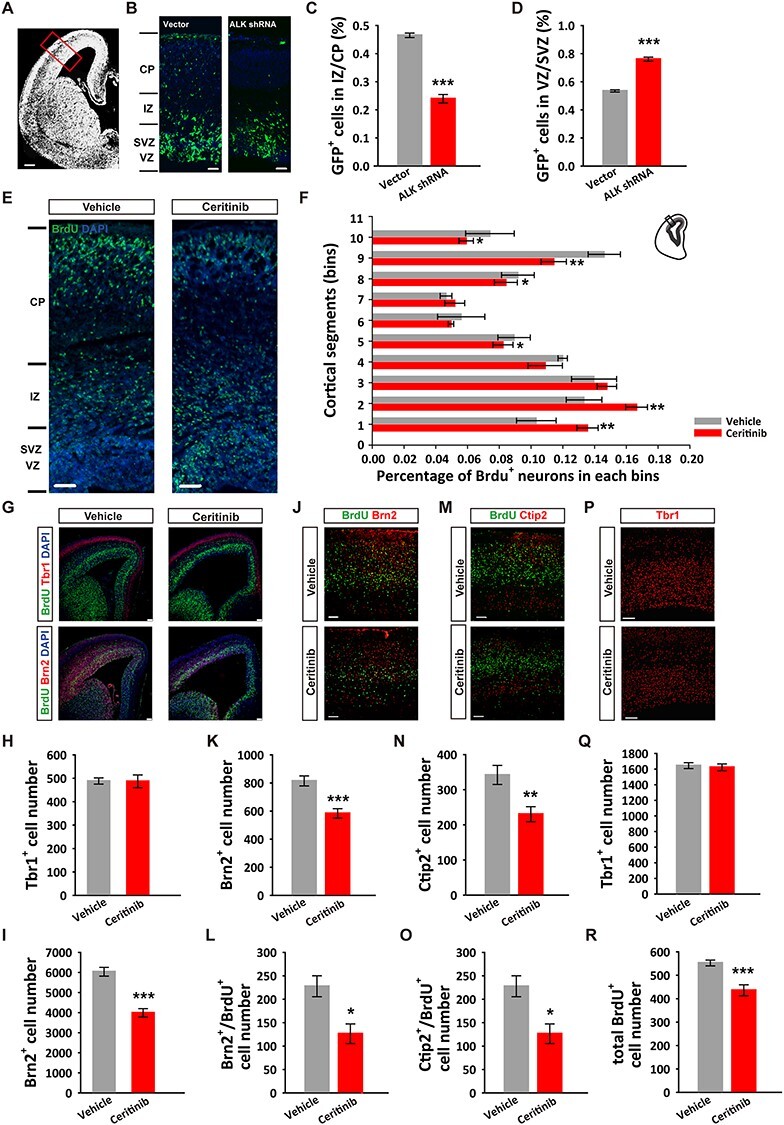
ALK is required for neuronal cortical positioning and adult cortical organization. (A) Image depicting a coronal brain section with the region of interest boxed. (B) Representative images showing the distribution of EGFP positive cells in E17.5 mouse cortices following in utero electroporation with the pGENESL1-EGFP control or pGENESL1-ALK shRNA-EGFP plasmid at E14.5. Scale bars, 200 μm (A), 20 μm (B). (C, D) Quantification of EGFP+ cells in VZ/SVZ and IZ/CP. n = 4 independent experiments per group. (E) Representative images showing the distribution of BrdU+ cells in E17.5 mouse cortices following ICV ventricle injections of vehicle or ceritinib at E14.5. Scale bars, 20 μm. (F) Distribution and quantification of BrdU+ cells in 10 equal bins (VZ 1 to CP 10). n = 9 independent experiments per group. (G) E15.5 cortical sections immunostained for Tbr1, Brn2, BrdU, and DAPI at 24 h post-ICV injections of ALK inhibitor. Scale bars, 50 μm. (H) Statistical result showing normal deep layer neuron (Tbr1+) number. n = 6 independent experiments per group. (I) Statistical result showing decreased upper layer neuron (Brn2+) number. n = 6 independent experiments per group. (J–L) P60 cortical sections immunostained for Brn2 and BrdU (J), Ctip2 and BrdU (K), Tbr1 (L) following ICV ventricle injections of vehicle or ceritinib at E14.5. Scale bars, 50 μm. (M, N) Quantification of Brn2+ and Brn2+/BrdU+ cells. (O, P) Quantification of Ctip2+ and Ctip2+/BrdU+ cells. (Q) Quantification of Tbr1+ cells. (R) Quantification of total BrdU+ cells. n = 3 independent experiments in each group. All data are presented as mean ± SEM. Statistical significance was determined by unpaired Student’s t-test (C, D, F, K, L, N, O, Q, R); one-way ANOVA, Dunnett’s test (H, J). *P < 0.05, **P < 0.01, ***P < 0.001.