
Figure 2 .
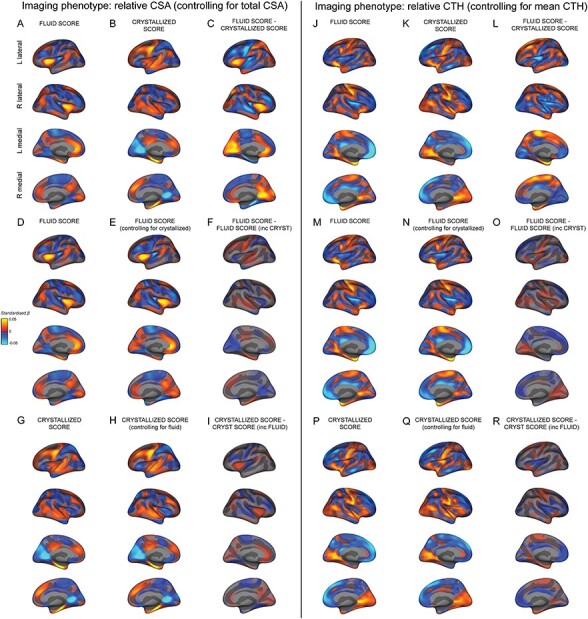
Distinct estimated effect size maps of association between the regionalization of cortical morphology and fluid and crystallized composite scores. All maps display the vertex-wise mass univariate standardized beta coefficients unthresholded for CSA (left) and CTH (right). A+D) The association between relative CSA and the fluid composite score and (B+G) the crystallized composite score. C) The difference in standardized beta coefficients between A+B. E) The association between relative CSA and the fluid composite score controlling for the crystallized composite score. F) The difference in standardized beta coefficients between D+E. H) The association between relative CSA and the crystallized composite score controlling for the fluid composite score. I) The difference in standardized beta coefficients between G+H. J+M) The association between relative CTH and the fluid composite score and (K+P) the crystallized composite score. L) The difference in standardized beta coefficients between J+K. N) The association between relative CTH and the fluid composite score controlling for the crystallized composite score. O) The difference in standardized beta coefficients between M+N. Q) The association between relative CTH and the crystallized composite score controlling for fluid composite score. R) The difference in standardized beta coefficients between P+Q. The estimated effect size maps showing the association between cortical morphology and the fluid and crystallized composite scores have distinct patterns. These behavioral measures show very little overlapping variance with the regionalization of CSA and CTH.