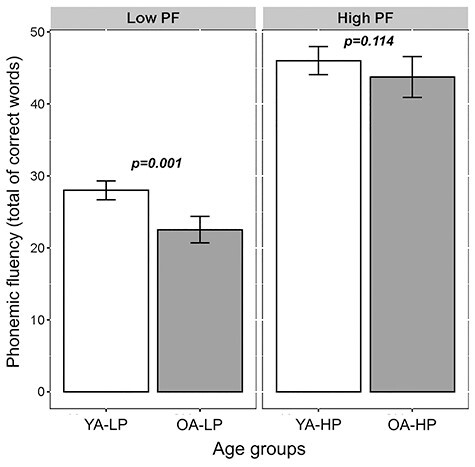
Figure 3 .

Interaction between age and performance groups with PF as the outcome measure (ANOVA). Bars represent the mean of correct words produced and the jack-knifes represent the 95% confidence intervals. Low PF, low PF performance groups; high PF, high PF performance groups. The OA group performed worse than the YA group in PF but only within the LP groups (younger adults with low PF performance, YA-LP vs. older adults with low PF performance, OA-LP, F3,263 = 136.93, P = 0.001).
