
Figure 4 .
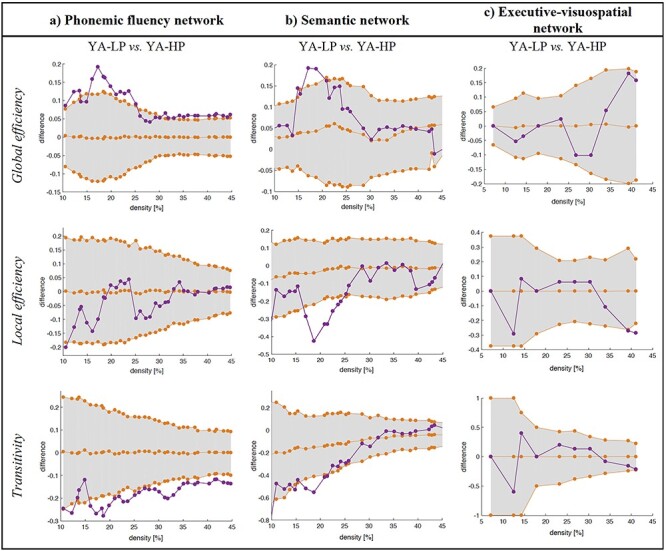
Comparison between the young performance groups (YA-LP vs. YA-HP) across global graph measures. a) Phonemic fluency cortical network. b) Semantic cortical network. c) Executive-visuospatial cortical network. Network densities are displayed on the x-axis from min = 10% to max = 45%, in steps of 1%. Between-group differences in the global graph measures are displayed on the y-axis. The 95% confidence intervals were used as critical values for testing of the null hypothesis at p ≤ 0.05 (two-tailed), however, graphs show the one-tailed t-test results.