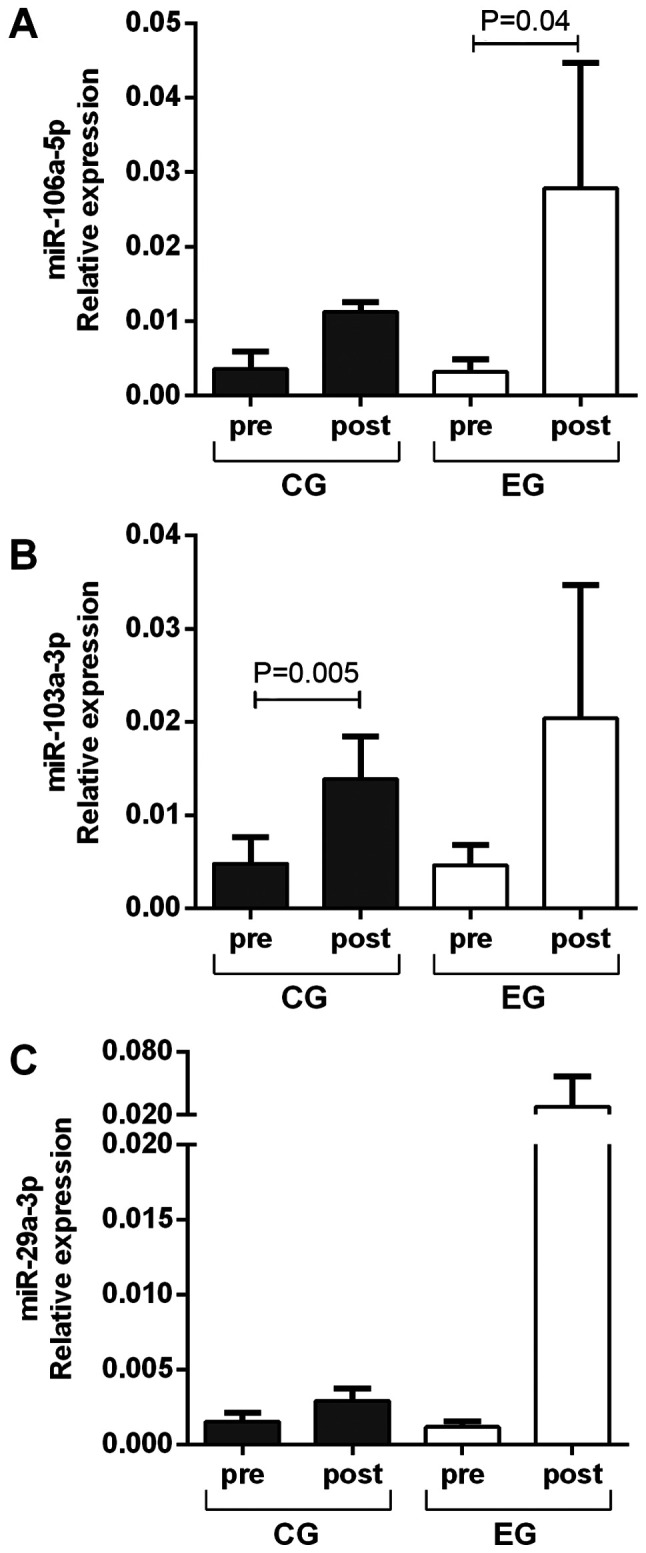
Figure 1.

Relative expression levels of (A) miR-106a-5p, (B) miR-103a-3p and (C) miR-29a-3p in the CG and EG before and after interval training on a cycle ergometer. Data are presented as the mean ± SD of relative expression. Statistical differences were calculated using the t-test for independent or paired samples. miR, microRNA; CG, control group; EG, experimental group.
