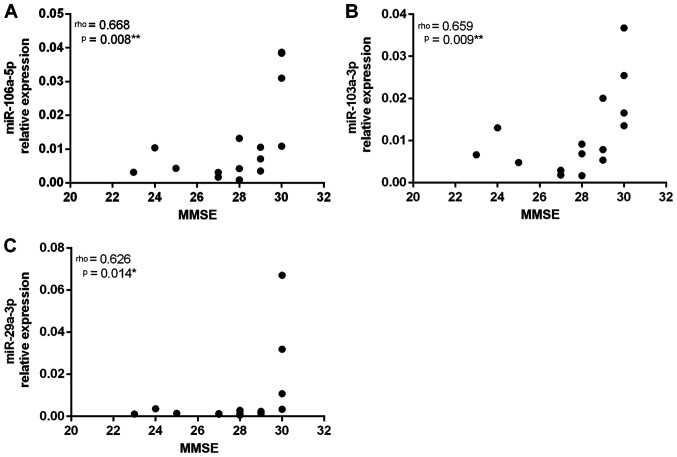
Figure 2.
Correlations between the values obtained in the MMSE and the relative expression levels of (A) miR-106a-5p, (B) miR-103a-3p and (C) miR-29a-3p. The correlation was assessed using the Spearman's Rank Correlation Coefficient (r). Significant P-values are marked with an asterisk. MMSE, Mini-Mental State Examination; miR, microRNA.

