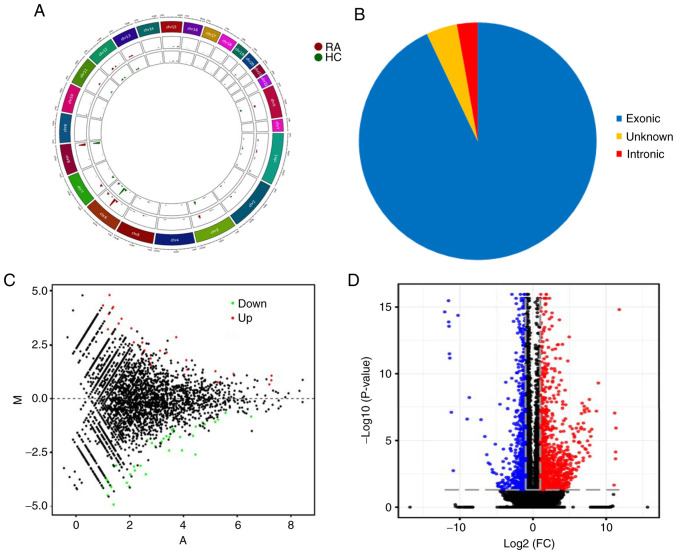
Figure 1.
Expression profiling of circRNA and mRNA in PBMCs of patients with RA. (A) Circos plot showing the locations of circRNAs on human chromosomes. The outermost layer was a chromosome map of the human genome. The inner 2 circles represent all circRNAs of RA and HC samples detected by RNA-seq. The bar chart presents the expression levels of circRNA. (B) Classification of the significantly dysregulated circRNAs based on genomic origin. (C) MA plot showing significantly differentially expressed genes across the range of mean values between RA and HC. The x-axis is A (mean average) scales and the y-axis is M (log2-fold change). The red points represent significantly upregulated circRNAs and the green points represent significantly downregulated circRNAs. (D) Volcano plot representing the dysregulated mRNAs between RA and healthy controls. The two vertical grey dotted lines correspond to two-fold up- and downregulation (log2 scaled), while the horizontal grey dotted line represents a P=0.05 (log10 scaling). The red points represent significantly upregulated mRNAs and the blue points represent significantly downregulated mRNAs. circRNA, circular RNA; PBMCs, peripheral blood mononuclear cells; RA, rheumatoid arthritis; RNA-seq, RNA sequencing; HC, healthy controls; FC, fold change.

