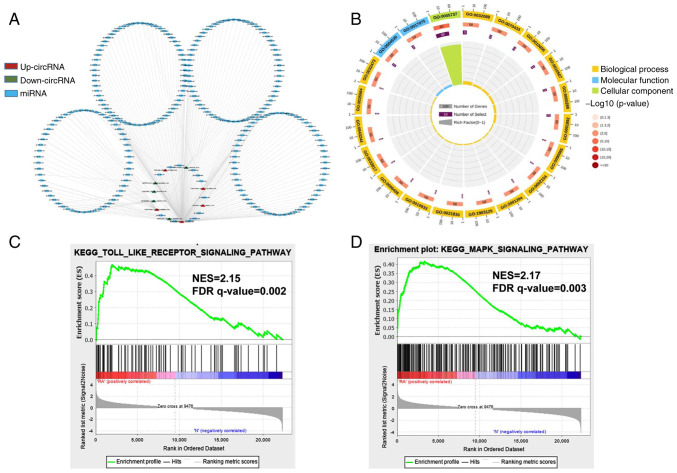
Figure 2.
Network construction of circRNA-miRNA interactions and GO and KEGG pathway analysis for the differentially expressed genes. (A) Construction of the circRNA-miRNA regulatory network. The circRNA-miRNA regulatory network included 10 circRNAs and 251 miRNAs (red, upregulated circRNAs; green, downregulated circRNAs; blue, miRNA). (B) The top 20 significantly enriched GO annotations in BP, MF and CC placed in three columns in the circle diagram. The outermost layer was a GO ID and specific GO term information is shown in Table SI. The inner circles from outside to inside corresponded to the number of genes sequenced by their enrichment scores (−log10 of the P-values), number of selected genes and rich factor, respectively. The coloured dots represent the enriched P-values, yellow represents BP, blue represents MF and green represents CC. Gene set enrichment analysis was performed to determine the differential expression of mRNAs for the (C) Toll-like receptor and (D) MAPK signaling pathways. circRNA, circular RNA; miRNA, microRNA; GO, Gene Ontology; KEGG, Kyoto Encyclopedia of Genes and Genomes; BP, biological process; MF, molecular function; CC, cellular component; NES, Normalized enrichment scores; FDR, false discovery rate.

