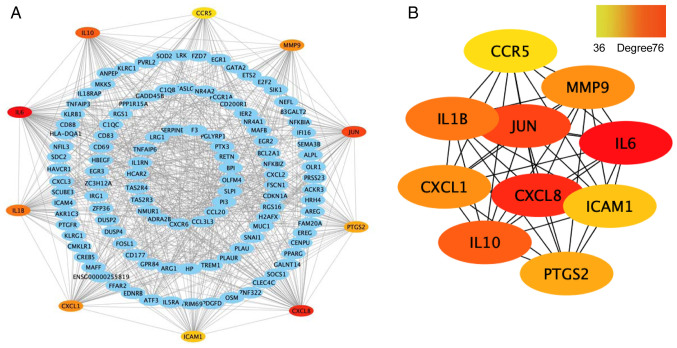
Figure 7.
Construction of the PPI network and identification of hub genes. (A) PPI network constructed with the differentially expressed mRNA genes. Each node represents a protein and edges represent interactions between proteins. (B) Top 10 genes with a high degree calculated by cytoHubba (degree >35). The darker the red colour, the higher the degree. PPI, protein-protein interaction.

