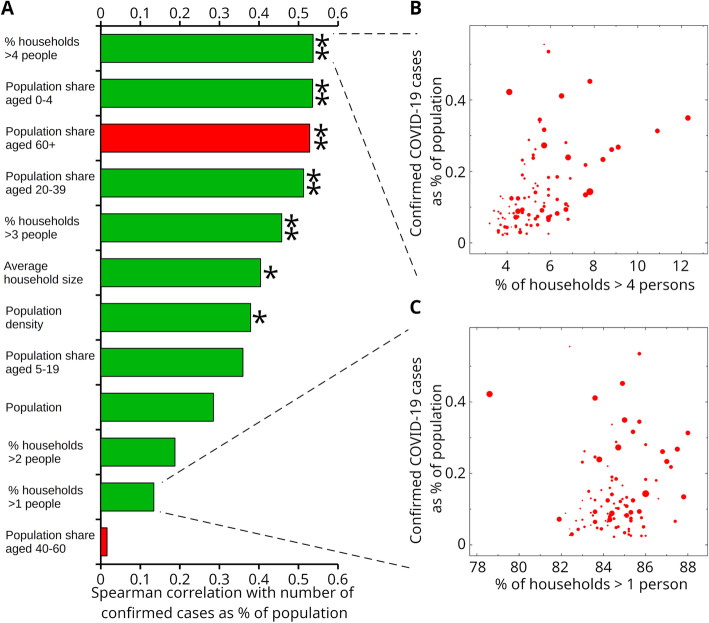
Fig. 1.
Demographic parameters associated with COVID-19 spread in France. A Correlation histogram (positive, green; negative, red) shows larger household sizes significantly correlated with levels of COVID-19 hospitalizations. Single (double) star indicates Bonferroni-corrected significance P < 0.01 (P < 0.001). Panels B and C show scatter plots of confirmed cases (as percentage of population) for the 96 departments of European France as function of the percentage of households larger than four persons and one, respectively. Size of markers is proportional to the population of each department

