
Figure 1.
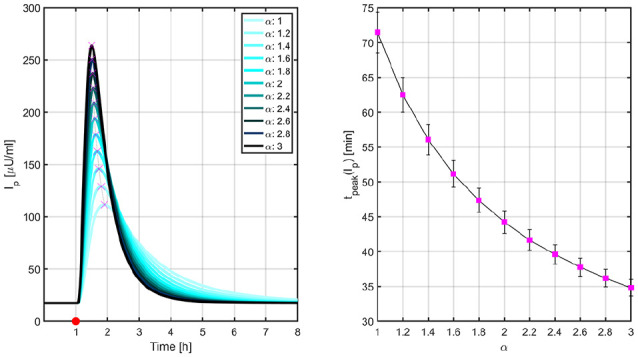
Mean PK profiles (left) and times to peak insulin levels (right) for different values of .
Left: the red circle indicates the time that the 0.2 U/kg insulin bolus was administered and the magenta crosses, the peak levels. Right: vertical lines represent the standard error bars. PK, pharmacokinetic.