
Figure 3.
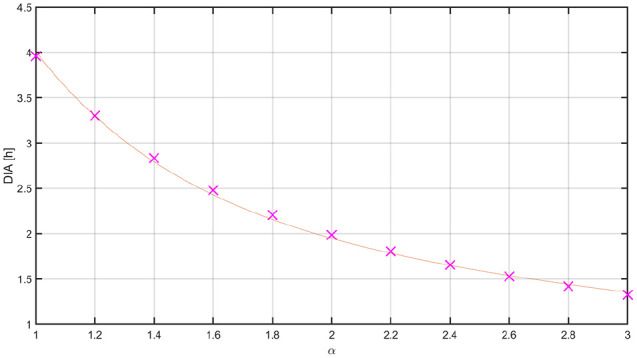
Mean DIA for different values of .
The red line represents the fitted exponential function. DIA, duration of insulin action.
Official websites use .gov
A
.gov website belongs to an official
government organization in the United States.
Secure .gov websites use HTTPS
A lock (
) or https:// means you've safely
connected to the .gov website. Share sensitive
information only on official, secure websites.
Mean DIA for different values of .
The red line represents the fitted exponential function. DIA, duration of insulin action.