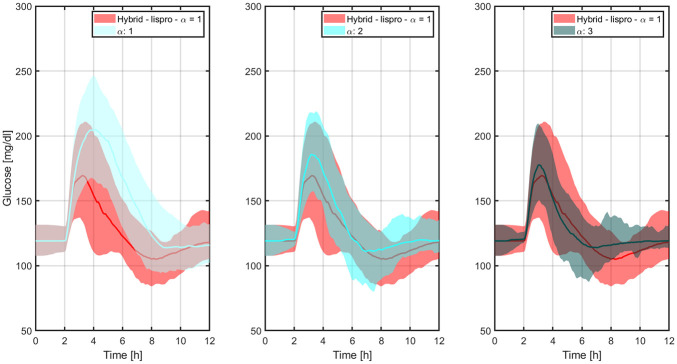
Figure 6.
Comparison between the glucose trajectories obtained with LIS and the baseline hybrid controller, and the ones obtained with -insulin and different levels of controller’s aggressiveness.
The thick lines are the median values, and the boundaries of the filled areas represent the 5th and 95th percentiles. LIS, insulin lispro.

