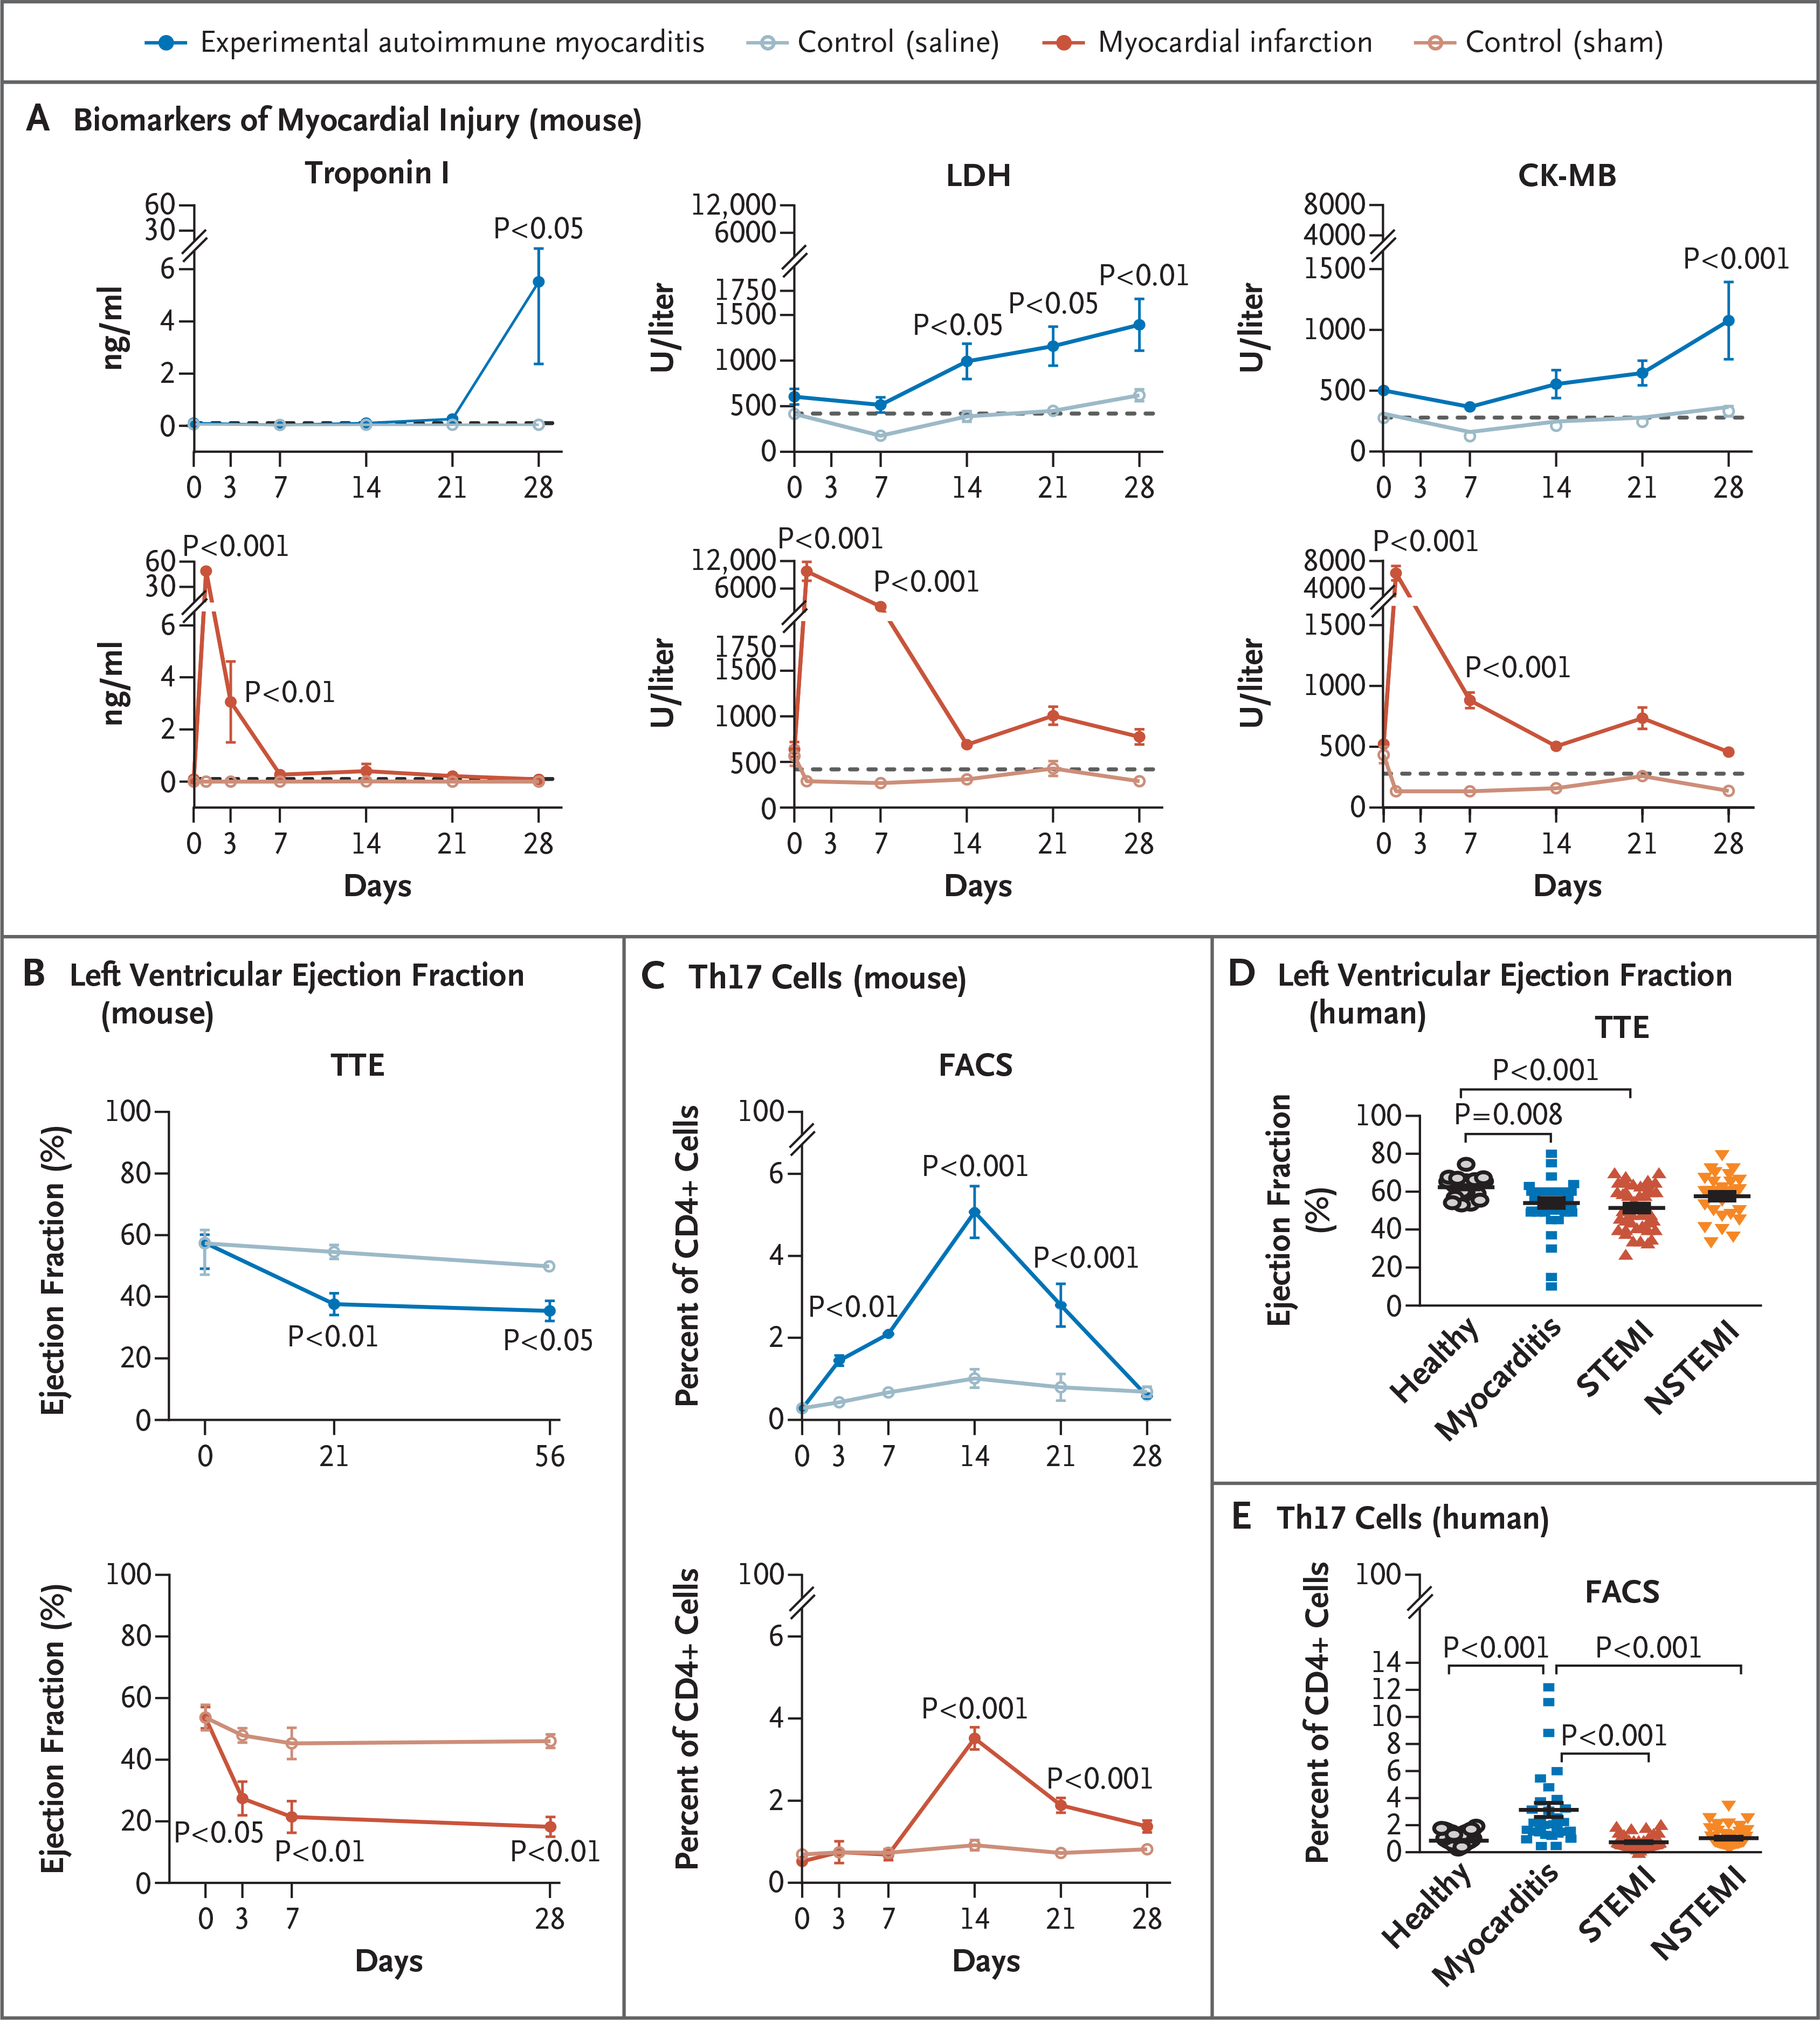
Figure 1 (facing page). Circulating Th17 Cells in Acute Myocarditis.

Panel A shows the kinetics of biomarkers of myocardial injury — troponin I, lactate dehydrogenase (LDH), and creatine kinase MB (CK-MB) — in the serum of BALB/c mice after induction of experimental autoimmune myocarditis (following immunization with cardiac α-myosin heavy-chain peptide) as compared with control mice (following immunization with phosphate-buffered saline). Also shown are the changes in the same biomarkers after the induction of myocardial infarction (following ligation of the left anterior descending coronary artery) as compared with control mice (following a sham operation). Dashed lines represent basal levels of each biomarker. P values, which are shown for the comparisons with controls, were calculated by two-way analysis of variance with Sidak’s multiple comparisons test. Data are representative of more than three independent experiments in 3 to 10 pools of two mice each. Panel B shows the time course of changes in the left ventricular ejection fraction after the induction of myocarditis or myocardial infarction, as quantified by transthoracic echocardiography (TTE), with 4 to 7 mice per group. Panel C shows the time course of changes in the percentage of type 17 helper T (Th17) cells in CD4+ T cells in the blood of BALB/c mice after myocarditis or myocardial infarction (and respective controls), according to the results of fluorescence-activated cell sorting (FACS) in 6 mice per group. P values were calculated by means of two-way repeated-measures analysis of variance (Sidak’s post hoc test). Data in Panels B and C are representative of more than three independent experiments. Panel D shows the left ventricular ejection fraction, as measured by TTE, in samples obtained from 43 patients with myocarditis, 43 patients with ST-segment elevation myocardial infarction (STEMI), 35 patients with non-STEMI (NSTEMI), and 23 healthy controls. Data were analyzed by means of the Kruskal–Wallis test with Dunn’s multiple comparisons test. Panel E shows the quantification of Th17 cells on FACS as a percentage of all CD4+ T cells in peripheral-blood samples obtained from patients with acute myocarditis, STEMI, or NSTEMI and from healthy controls. P values were calculated by the same method used in Panel D and were performed in the analysis of samples from 33 patients with myocarditis, 45 with STEMI, and 41 with NSTEMI, along with 62 healthy controls. In all five panels, the data are represented as means, with I bars representing standard errors.
