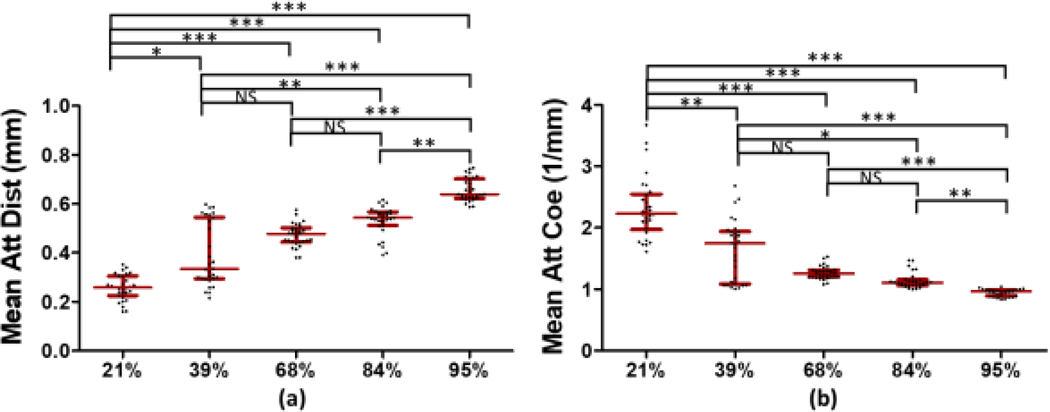
Fig. 7.

Three samples in each RBC composition were incorporated into one large group. (a) indicates the median attenuation distance with their IQRs and (b) shows the median attenuation coefficient with their IQRs. The abbreviation of Att, Dist and Coe in y-axis represent attenuation, distance and coefficient, respectively, and the symbols *, ** and *** indicate the p-value < 0.05 and < 0.01 and < 0.001, respectively. The abbreviation of NS means non-significant.
