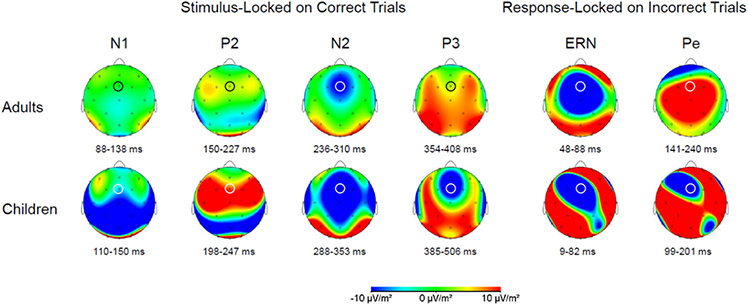
Figure 1.
The topographic distribution on the stimulus-locked correct trials (N1, P2, N2, and P3 components) and response-locked incorrect trials (ERN and Pe components) for adults and children. The channel FCz is marked with a while/black circle. Note: the time windows used to determine the topographic distribution for each component were calculated based on the averaged mean latency across sessions +/− averaged mean standard deviation across sessions for each age group

