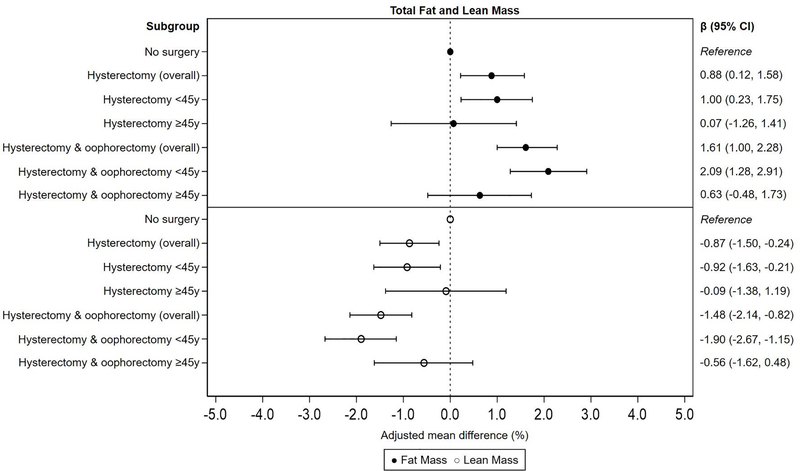
Figure 1.
Multivariable-adjusted mean percent difference and 95% CI for total fat and lean mass by hysterectomy and oophorectomy status, overall and by age at surgery. Adjusted for age at interview, race, smoking, alcohol use, education, BMI at age 25, parity, oral contraceptive use, and post-surgery estrogen replacement therapy use.

