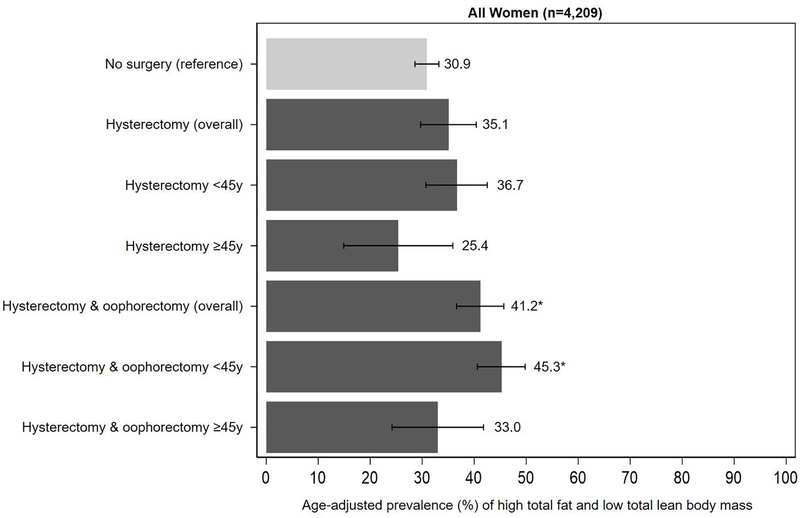
Figure 3.
Age-adjusted prevalence of high total fat and low total lean body mass by hysterectomy and oophorectomy status, overall and by age at surgery. High total fat mass and low total lean body mass defined as total fat mass ≥43.7% (tertile 3) and total lean mass <53.7% (tertile 1). Tertile cut points are based on values among women without a history of hysterectomy and oophorectomy.
*P <0.05 for absolute differences in age-adjusted prevalence (reference group: no surgery).

