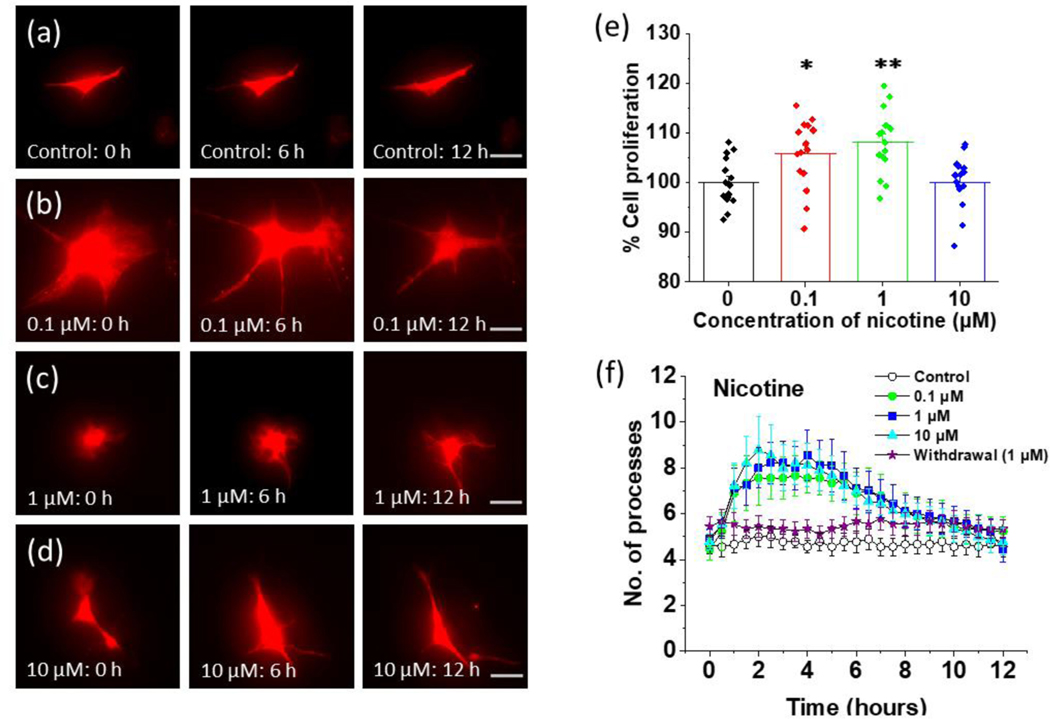
FIGURE 1.
Time lapse imaging of the effect of nicotine on cultured astrocytes from Aldh1l1-tdTomato mice. (a) Aldh1l1-tdTomato astrocytes imaged at different time intervals in the absence of treatment (0 hours, 6 hours, and 12 hours, scalebar = 40 μm). (b) Aldh1l1-tdTomato astrocytes imaged at different time intervals after treatment with 0.1 μM nicotine (0 hours, 6 hours, and 12 hours, scalebar = 40 μm). (c) Aldh1l1-tdTomato astrocytes imaged at different time intervals after treatment with 1 μM nicotine (0 hours, 6 hours, and 12 hours, scalebar = 40 μm). (d) Aldh1l1-tdTomato astrocytes imaged at different time intervals after treatment with 10 μM nicotine (0 hours, 6 hours, and 12 hours, scalebar = 40 μm). (e) The proliferation of astrocytes at different concentrations of nicotine. Astrocytes were exposed to different concentrations of nicotine (0.1 μM, 1 μM, and 10 μM) for 24 hours. The cell proliferation was determined by using MTT (3-(4,5-dimethylthiazol-2-yl)-2,5-diphenyltetrazolium bromide) assay. Absorbance was measured and data was plotted by converting into percent cell proliferation where the mean of control is 100%. One-way ANOVA for cell proliferation at different concentrations of nicotine (n = 59, p < 0.001) was used. Bonferroni and Holm inference for post hoc analysis *p = 0.022 for control vs 0.1 μM, **p = 0.002 for control vs 1 μM, p = 0.959 for control vs 10 μM. Data are expressed in the form of mean ± SEM from 3–5 independent culture conditions. (f) Quantification of the number of processes at 30 min intervals for 12 hours for control and nicotine treated astrocytes. For withdrawal, astrocytes were pretreated with 1 μM nicotine for 24 hours and then removed at time. An illustration of regions of interests (ROIs) for processes measurements are shown in Supplementary Figure 1. One-way ANOVA was performed for each 3-hour interval (n = 45), plots shown in Supplementary Figure 2 in (a), (b), (c), and (d) for number of processes at different concentration of nicotine. Data are expressed in the form of mean ± SEM from 3–5 independent culture conditions.

