FIGURE 3.
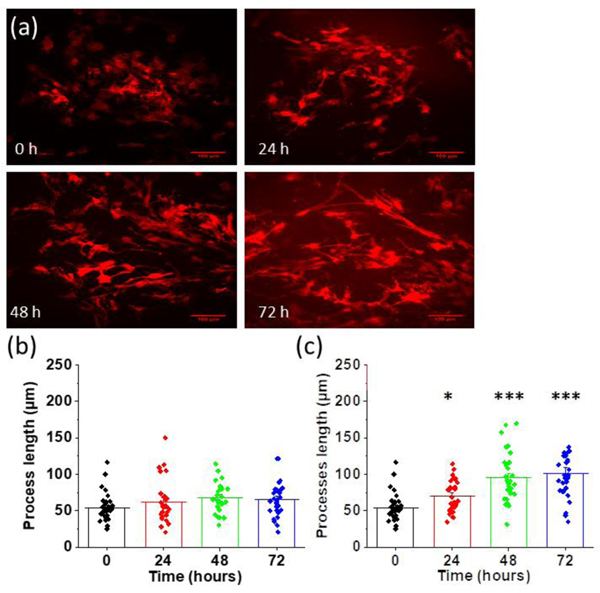
Chronic nicotine-induced morphological changes in astrocytes. (a) Representative images of astrocytes before (0 hours) and after treating with 1 μM of nicotine at 24 hours interval for a total of 72 hours (scalebar = 100 μm). (b) Quantification of the length of processes in control astrocytes at 24-hour intervals (p = 0.136). (c) Quantification of the length of processes in astrocytes treated with 1 μM of nicotine at 24-hour intervals for a total of 72 hours. One-way ANOVA for length of processes at 0 hours, 24 hours, 48 hours, and 72 hours after nicotine treatment (n = 121, p < 0.001). Bonferroni and Holm inference *p = 0.037 for 0 hours vs 24 hours, ***p < 0.001 for 0 hours vs 48 hours and 0 hours vs 72 hours. Data are expressed in the form of mean ± SEM from 3–5 independent experiments. An illustration of regions of interests (ROIs) for processes measurement in shown in Supplementary Figure 5.

