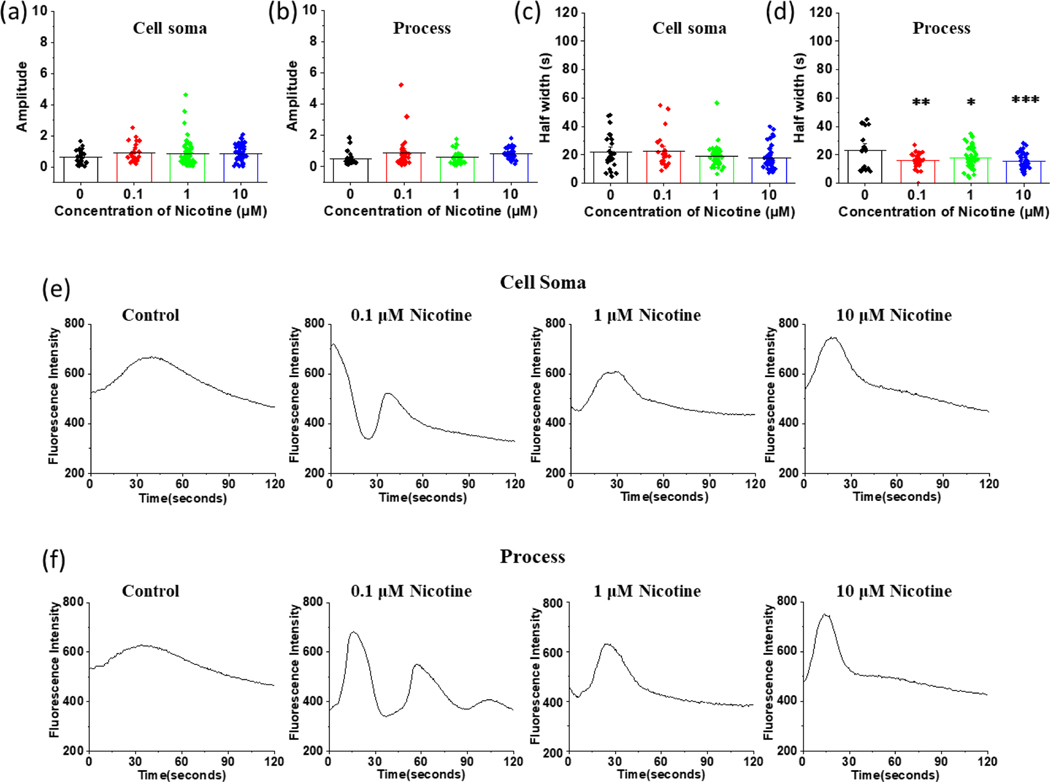
FIGURE 6.
Comparison of average half-width, amplitude, and calcium fluctuation of astrocytic cell soma and processes at different concentrations of nicotine. (a) Comparison of amplitude of astrocytic cell soma. One-Way ANOVA for amplitude of astrocytic cell soma (n = 154, p = 0.327). (b) Comparison of amplitude of astrocytic processes (n = 140, p = 0.134). (c) Average half-width of calcium events in astrocytic cell soma. One-Way ANOVA for half-width of cell soma events (n = 154, p = 0.083). (d) Average half-width of the calcium events in astrocytic processes, (n = 139, p = 0.001). Bonferroni and Holm post hoc analysis for half-width of events occurring in processes: control vs astrocytes treated with 0.1 μM nicotine **p = 0.001, control vs astrocytes treated with 1 μM nicotine *p = 0.011, control vs astrocytes treated with 10 μM nicotine ***p < 0.001. (e) Representative calcium waves from the cell soma of control astrocytes and astrocytes treated with different concentrations of nicotine (f) Representative calcium waves from the processes of control astrocytes and astrocytes treated with different concentrations of nicotine. Data are expressed in the form of mean ± SEM and were used from 3–5 independent cultures.

