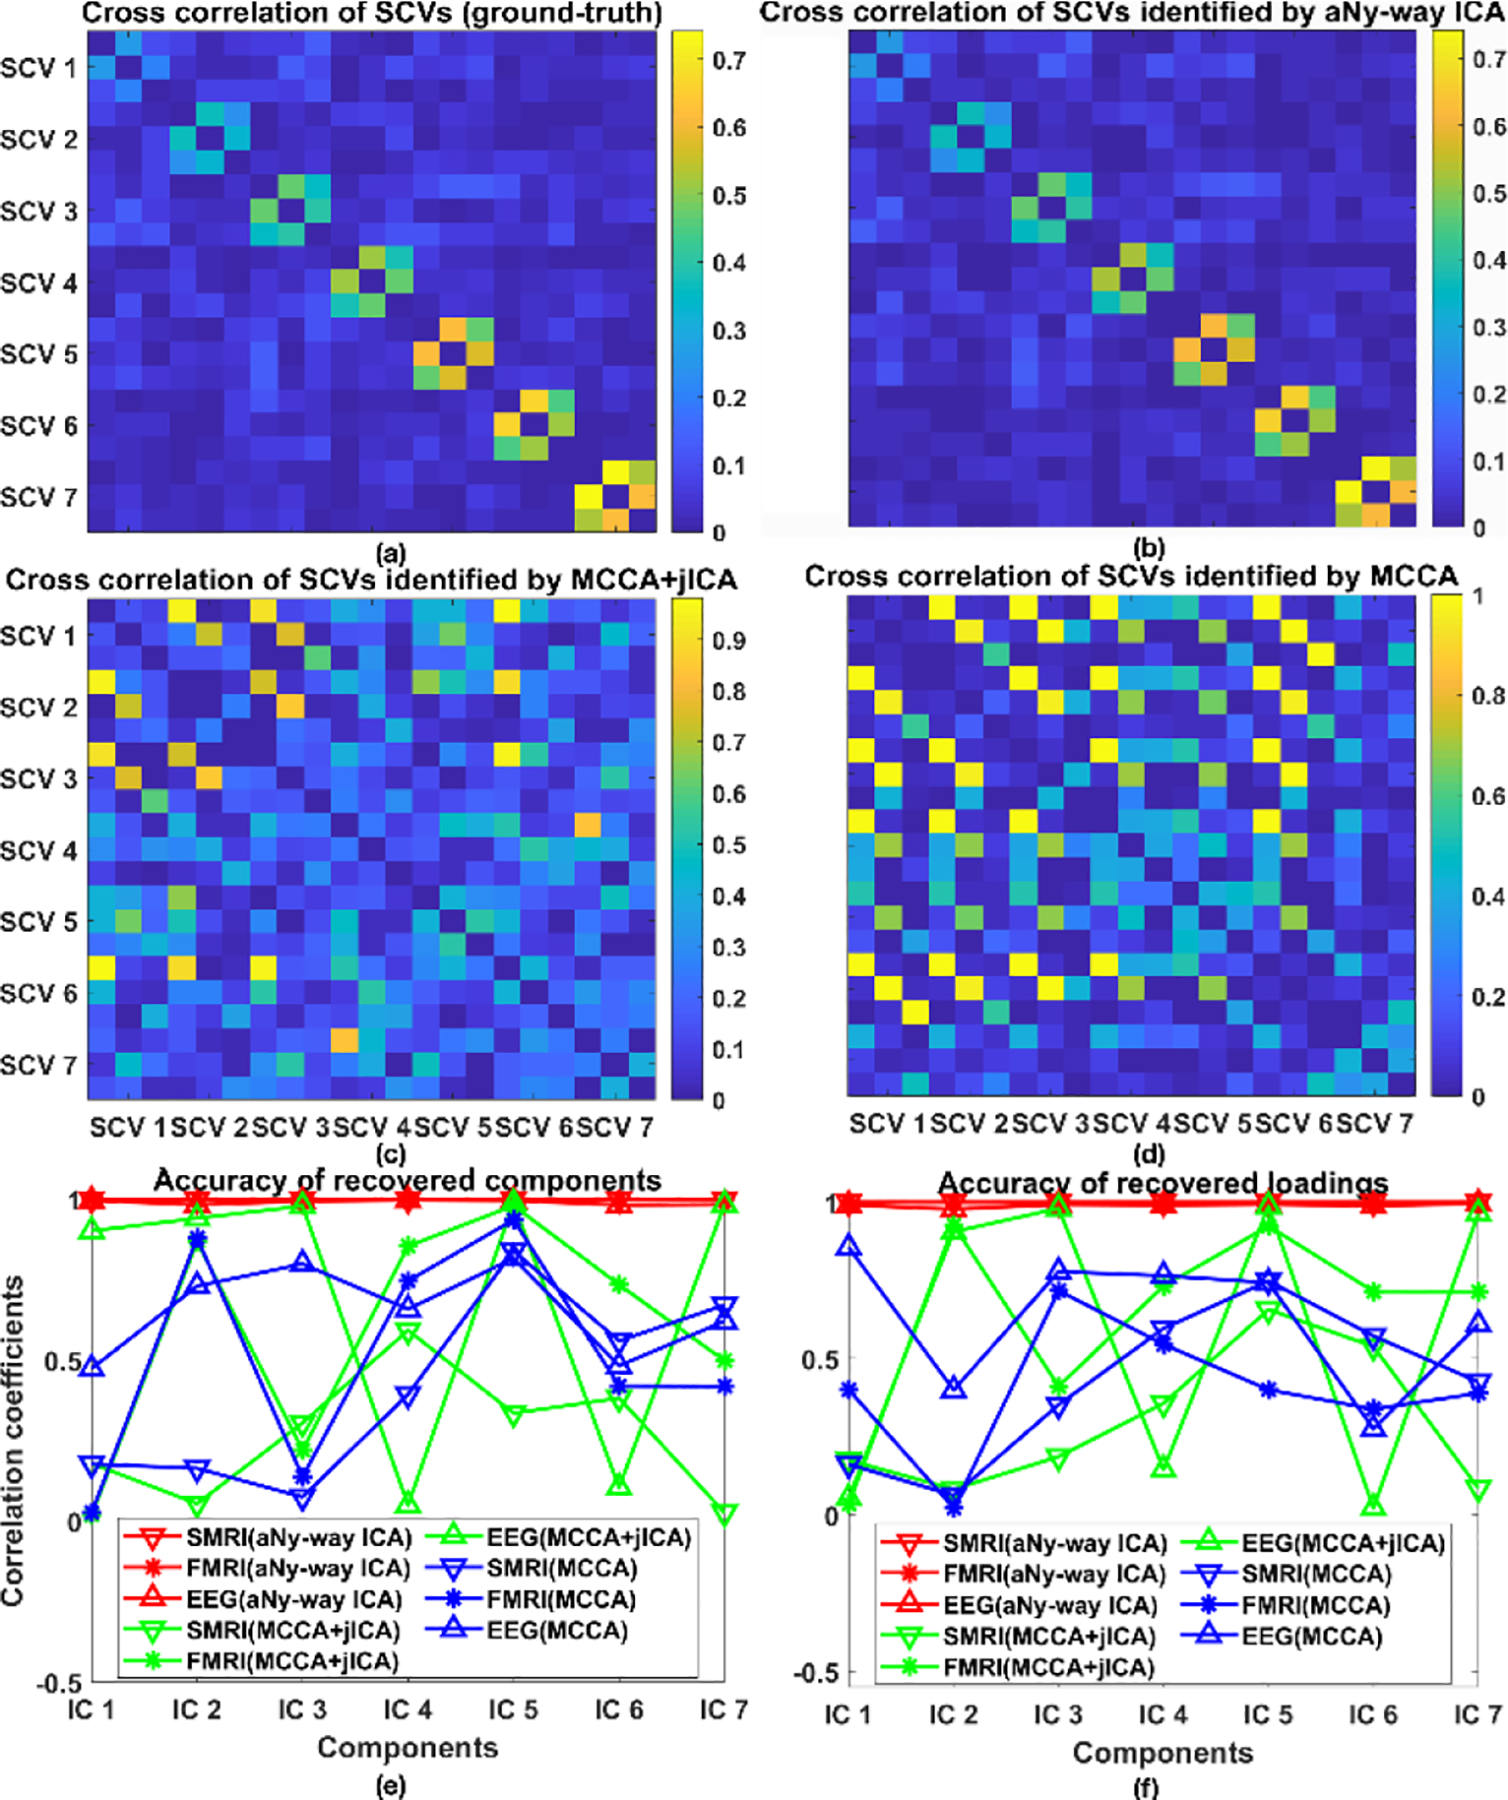
Figure 3.

Scenario 1. Cross-correlation of SCVs from (a) groundtruth, (b) aNy-way ICA, (c) mCCA+jICA, and (d) mCCA. Correlation coefficients between (e) recovered sources and ground-truth, and between (f) recovered loadings and ground-truth for each independent component (IC): sMRI (downward triangle), fMRI (star), and EEG data (upward triangle) from aNy-way ICA (red), mCCA+jICA(green) and mCCA(blue). Note that shapes and colors are consistent throughout the paper.
