Table 2.
Biochemical and Cellular Potency of Substituted Indoles
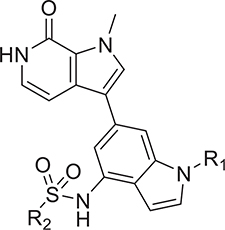 | |||||
|---|---|---|---|---|---|
| Compound | R1 | R2 | TR-BD1 IC50 (nM)a | CFR IC50 (nM)b | LLEc |
| 1 | - | - | 199 ± 25.6 | 90 ± 4.4 | - |
| 10 | 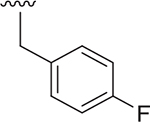 |
Me | 96± 11.8 | 17 ± 0.8 | 4.677 |
| 11 | 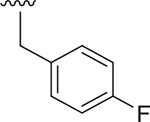 |
Et | 48 ± 9.0 | 56 ± 1.6 | 3.630 |
| 19 | 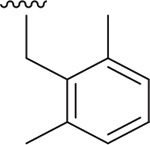 |
Et | 158 ± 24.4 | 35 ± 1.1 | 3.079 |
| 20 | 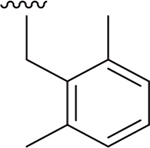 |
Me | 175 ± 23.5 | 49 ± 1.9 | 3.462 |
| 21 | 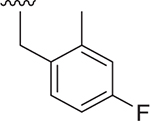 |
Me | 600 ± 190.0 | 119 ± 4.7 | 3.383 |
| 22 | 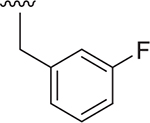 |
Me | 174 ± 21.9 | 70 ± 2.6 | 4.062 |
| 23 |  |
Me | 180 ± 27.9 | 134 ± 6.4 | 5.789 |
| 24 |  |
Me | 161 ± 29.6 | 62 ± 2.3 | 4.858 |
| 25 |  |
Et | 83 ± 10.9 | 15 ± 0.5 | 2.997 |
| 26 |  |
Me | 12.9 ± 0.7 | 10 ± 0.7 | 6.297 |
| 27 |  |
Et | 5.9 ± 0.3 | 0.9 ± 0.03 | 6.814 |
| 28 |  |
Et | 9.4 ± 0.4 | 2.2 ± 0.09 | 5.897 |
TR-FRET assay BRD4(1) bromodomain IC50 values are reported as the mean ± SD.
Cell survival was normalized to DMSO control (100%) and JQ1 (3 μM) as 0% assessed in a 5-day cell proliferation assay with one time drug treatment. Data show the mean ± SEM from at least two cell passages (triplicates in each passage).
LLE (LipE) = pIC50 – cLogP; IC50 of growth inhibition was used for calculations.
