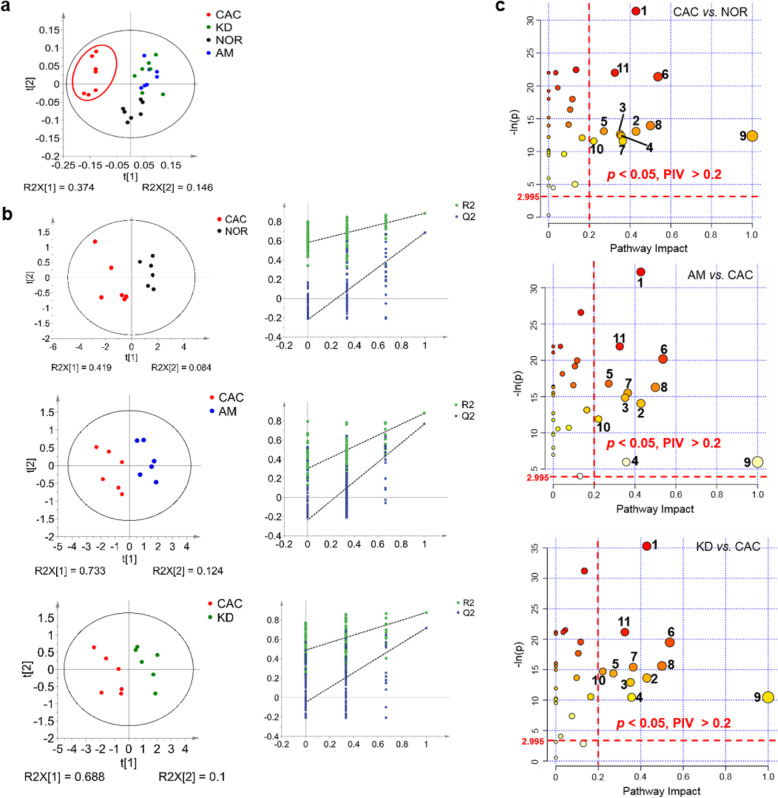
Fig. 5.
Metabolomic analyses of the NOR, CAC, AM and KD gastrocnemius. a PCA scores plot of 1D 1H NMR data obtained on aqueous extracts derived from gastrocnemius of the NOR, CAC, AM and KD mice (n = 7). b PLS-DA scores plots and cross-validation plots of 1D 1H-NMR data obtained from gastrocnemius of the NOR, CAC, AM and KD mice. Top: CAC mice vs. NOR mice; Middle: AM mice vs. CAC mice; Bottom: KD mice vs. CAC mice. The PLS-DA models were cross-validated to evaluate their robustness with random permutation tests (200 cycles). c Metabolic pathway analyses of CAC vs. NOR, AM vs. CAC, KD vs. CAC, using the Pathway Analysis module provided by MetaboAnalyst 4.0. Numbers in the three panels represent significantly altered metabolic pathways, which were identified with -ln(p) > 2.995 (corresponding to p < 0.05) and pathway impact value > 0.2: 1, taurine and hypotaurine metabolism; 2, nicotinate and nicotinamide metabolism; 3, pyruvate metabolism; 4, phenylalanine metabolism; 5, glycine, serine and threonine metabolism; 6, alanine, aspartate and glutamate metabolism; 7, glutathione metabolism; 8, D-glutamine and D-glutamate metabolism; 9, phenylalanine, tyrosine and tryptophan biosynthesis; 10, histidine metabolism; 11, starch and sucrose metabolism. NOR, C57BL/6 or BALB/c normal control mice; CAC, CT26/LLC cachexia mice; AM, amiloride-treated mice; KD, mice inoculated with Rab27-knockdown CT26/LLC cells

