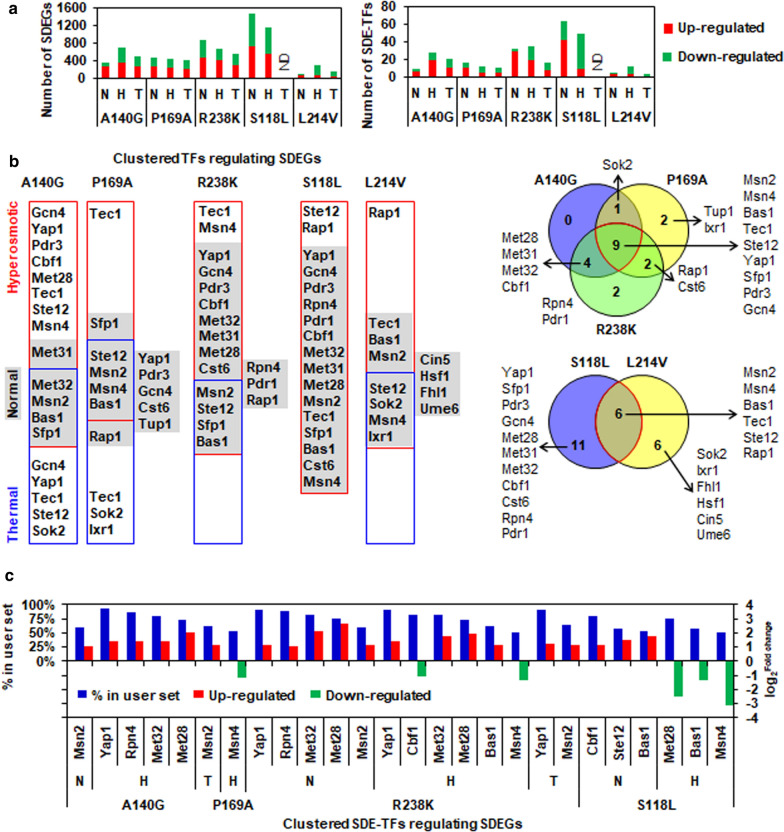
Fig. 6.
Transcription factor clustering in SDEGs influenced by key Spt15 mutants. a Number of SDEGs and SDE-TFs in comparisons of the key Spt15 mutant strains versus the wild-type strain BY4741 at each culture condition including normal (abbreviated as N), hyperosmotic (abbreviated as H) and thermal (abbreviated as T) stress conditions. b TFRank-suggested transcription factors clustering in SDEGs and their Venn diagrams among stress-tolerant and sensitive Spt15 mutant strains. c TFRank-suggested SDE-TFs clustering in SDEGs. In b and c, the tool of Rank by TF in the YEASTRACT database was used. Only the percentage of target genes in the user set higher than 50%, which are calculated as the ratio of the number of SDEGs that the TF can regulate to the number of total SDEGs, were considered. N normal condition, H hyperosmotic stress condition, T thermal stress condition, ND Not detected

