FIGURE 3.

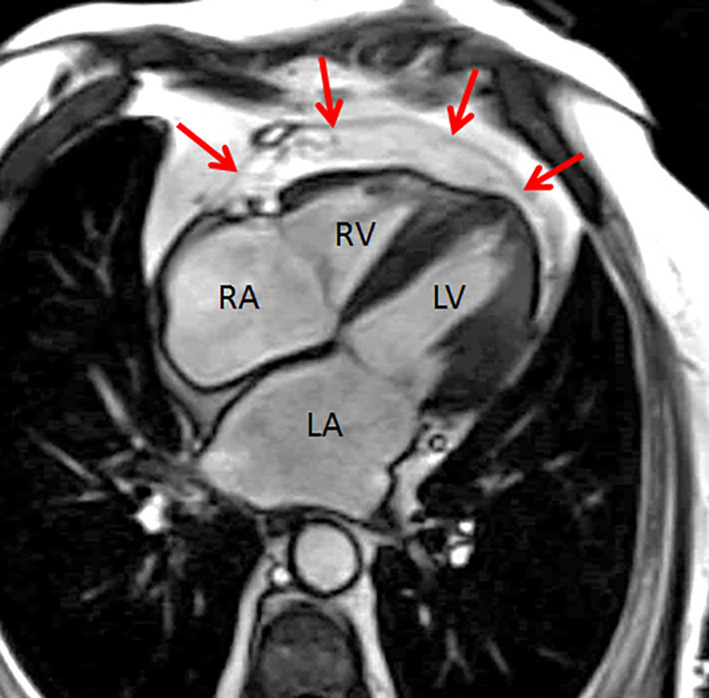
Typical example of epicardial adipose tissue (EAT) distribution around the right ventricle. The red arrows indicate the pericardium. LA, left atrium; LV, left ventricle; RA, right atrium; RV, right ventricle

Typical example of epicardial adipose tissue (EAT) distribution around the right ventricle. The red arrows indicate the pericardium. LA, left atrium; LV, left ventricle; RA, right atrium; RV, right ventricle